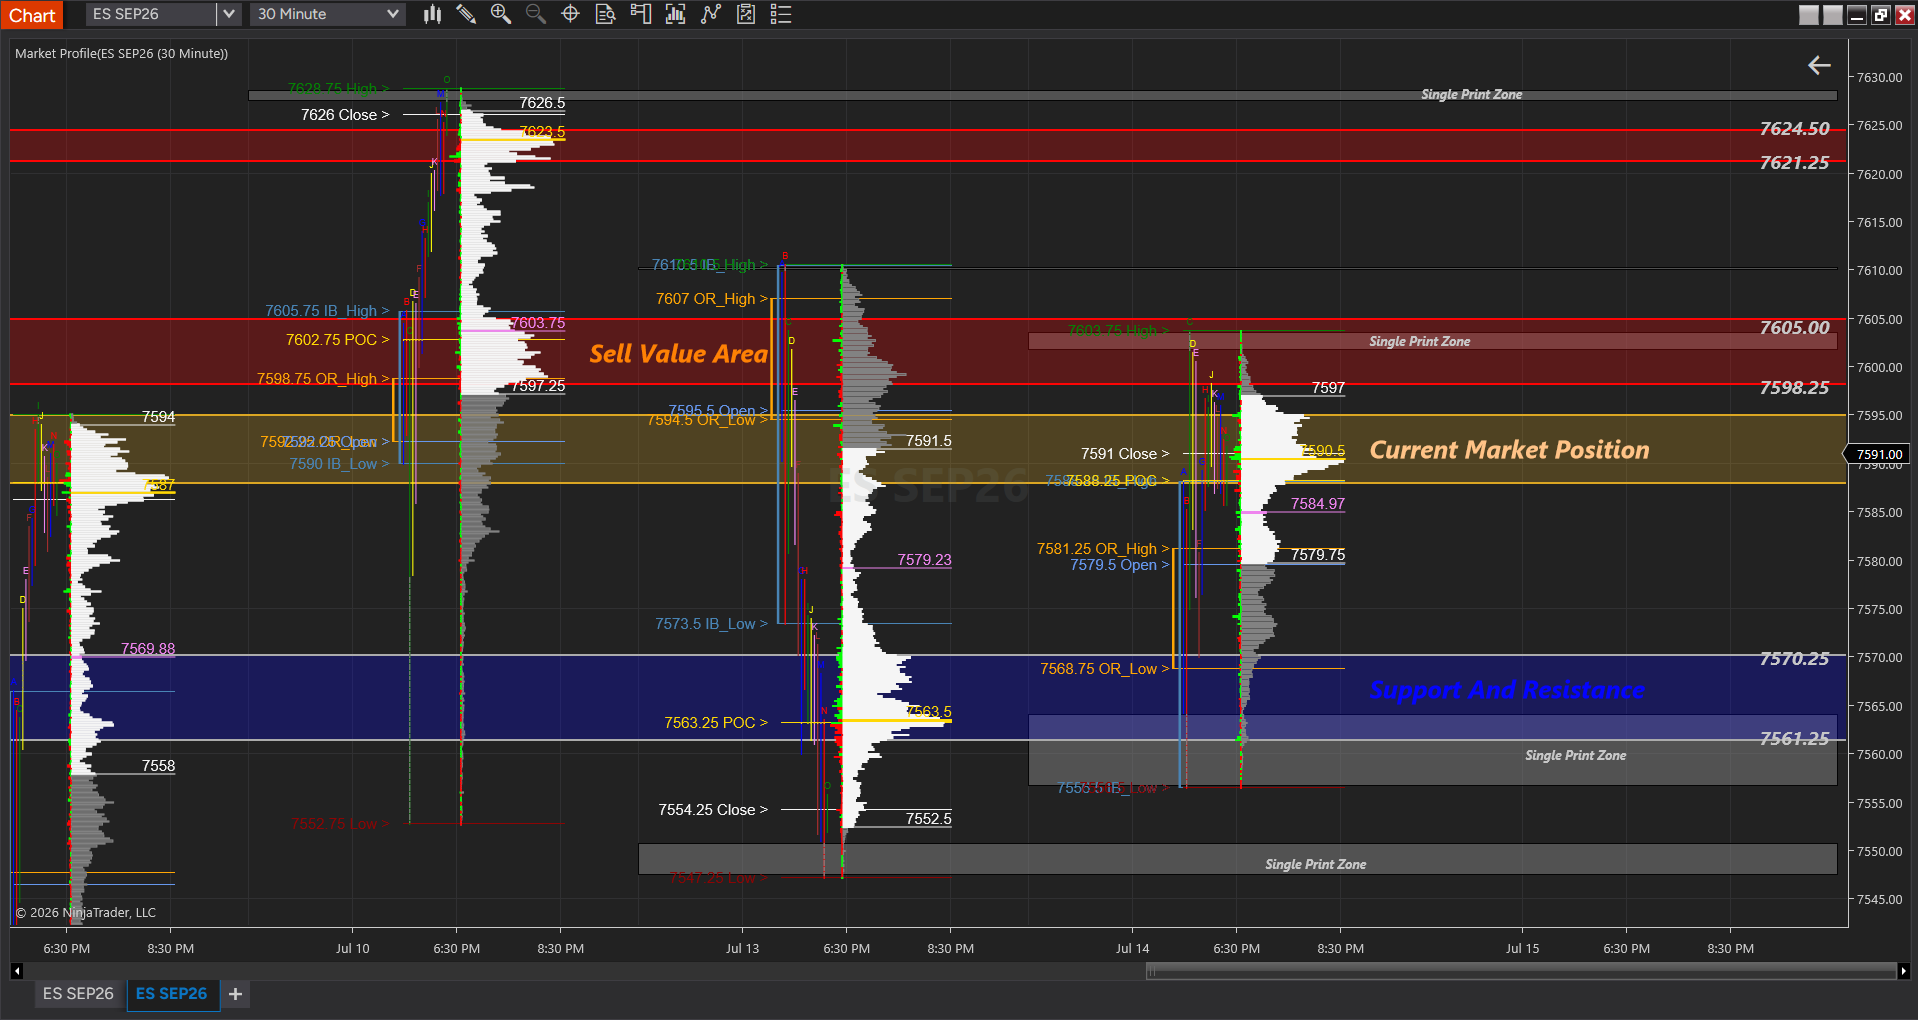
Opened Below the Value Area
The market opened below the main Value Area and then moved back toward the Sell Value Area, confirming that sellers still controlled the higher auction zone.

The current market structure remains bearish overall, but price is trading at an important decision area. This map highlights where buyers and sellers are active before the session opens.
Risk Warning: Futures, Forex, Stocks, and Cryptocurrency trading involve substantial risk and may not be suitable for all investors. Past performance is not indicative of future results.
Read the full Risk Disclosure →ES is currently trading near 7591.00, below the main Sell Value Area. The market has not yet confirmed a new uptrend because the upper sell zone has not been accepted.
The market is currently positioned around the 7588.25–7594.50 decision area. Acceptance above it can create a new short-term Buy Value Area, while acceptance below it may open the door for renewed selling pressure. The broader context remains bearish until buyers prove acceptance above the existing Sell Value Area.
Yesterday’s session provided two important auction-based setups: a countertrend long from support and a short rejection from the Sell Value Area.
The market opened below the main Value Area and then moved back toward the Sell Value Area, confirming that sellers still controlled the higher auction zone.
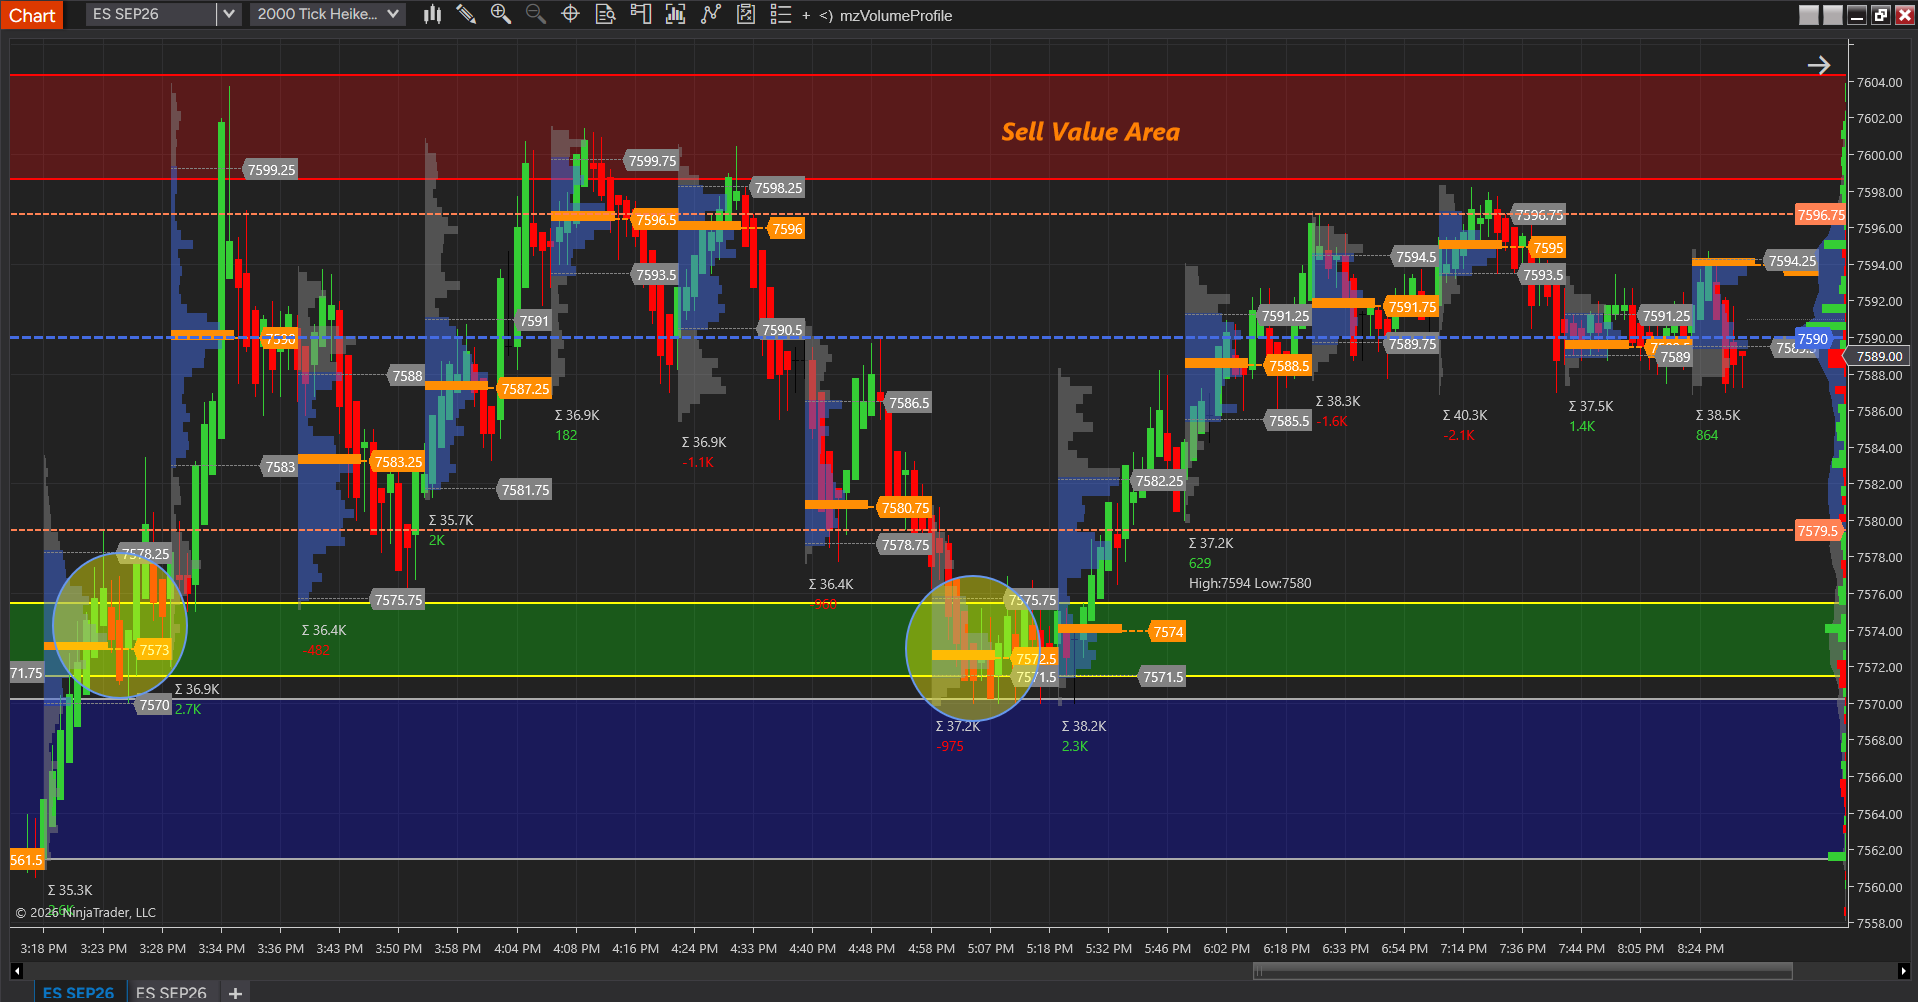
Price respected the lower buyer Support and Resistance zone, created visible auction behavior, and generated multiple reversion-long opportunities targeting the Sell Value Area.
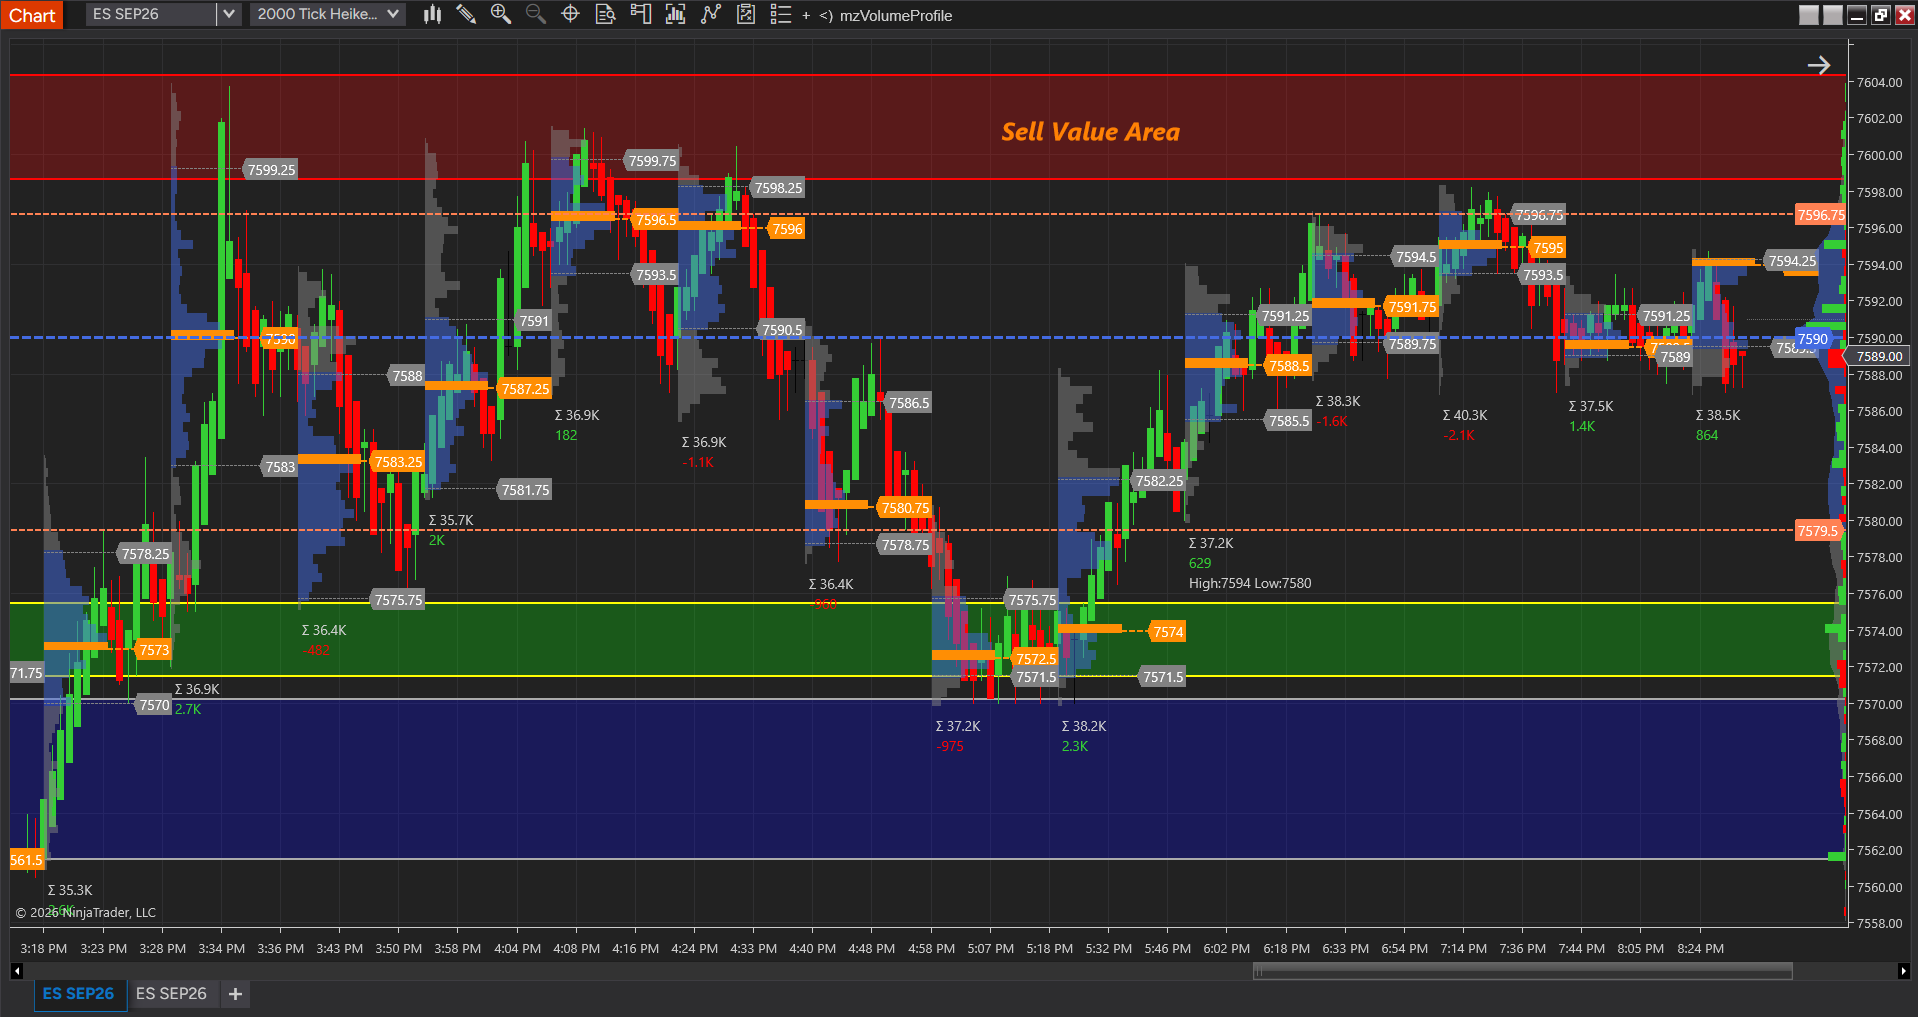
The lower support area continued to hold. Buyers created repeated auctions and defended the zone, showing that the market was not ready to continue lower immediately.
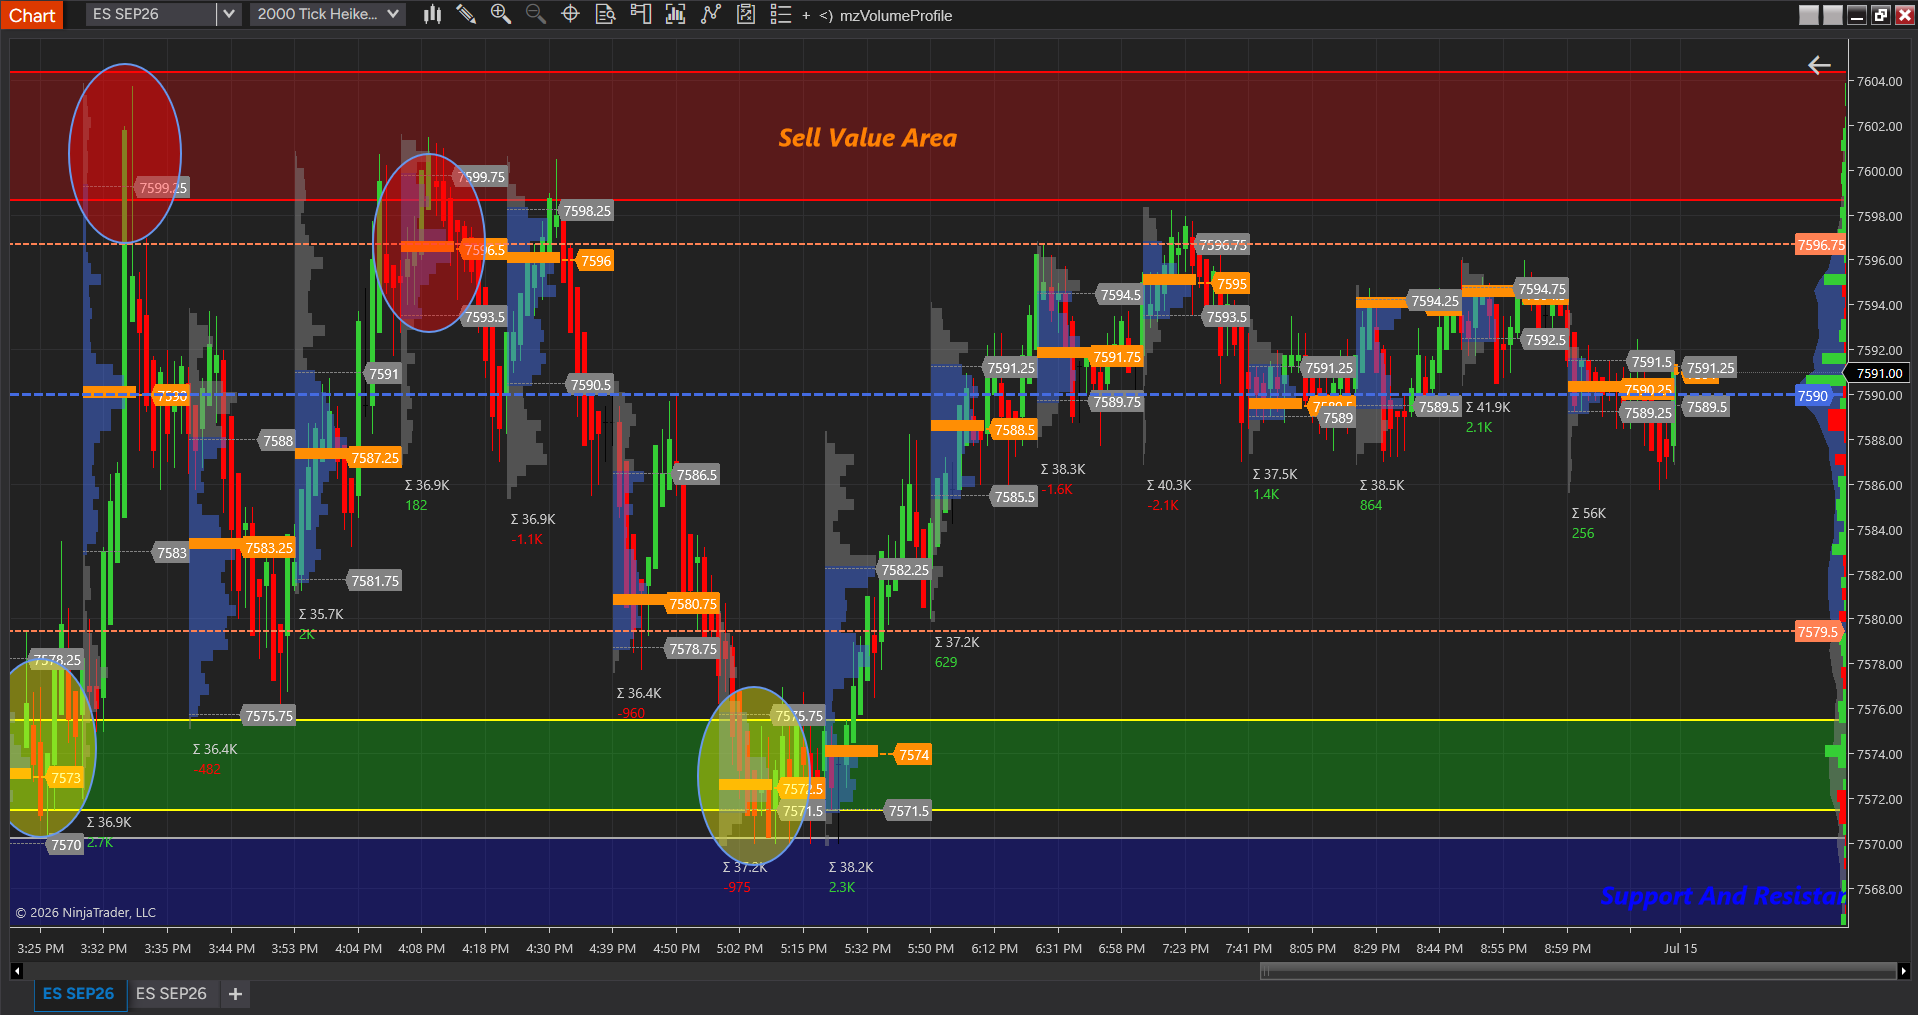
When price entered the Sell Value Area, strong rejection and buyer absorption appeared. This created the cleaner short setup from the upper zone.
The following scenarios are based on acceptance, rejection, and retest behavior around the current decision zones.
If price accepts above the current market-position zone, that area may become a new Buy Value Area. The preferred idea is to wait for a successful retest and then build a long setup toward the Sell Value Area.
If the market opens above the current Sell Value Area and holds with acceptance, the former Sell Value Area can transition into a Buy Value Area. The next objective would be the higher seller Support and Resistance zone.
If the market opens below the current market-position zone and confirms acceptance, the bias remains short. The preferred setup is a retest of the current area from below, followed by rejection and continuation lower.
If price stays trapped between the current market-position area and the Sell Value Area without acceptance, expect rotational or range behavior. Avoid forcing trades in the middle and focus on reactions at the edges.
This chart summarizes the present Sell Value Area, current market position, and buyer support zones.
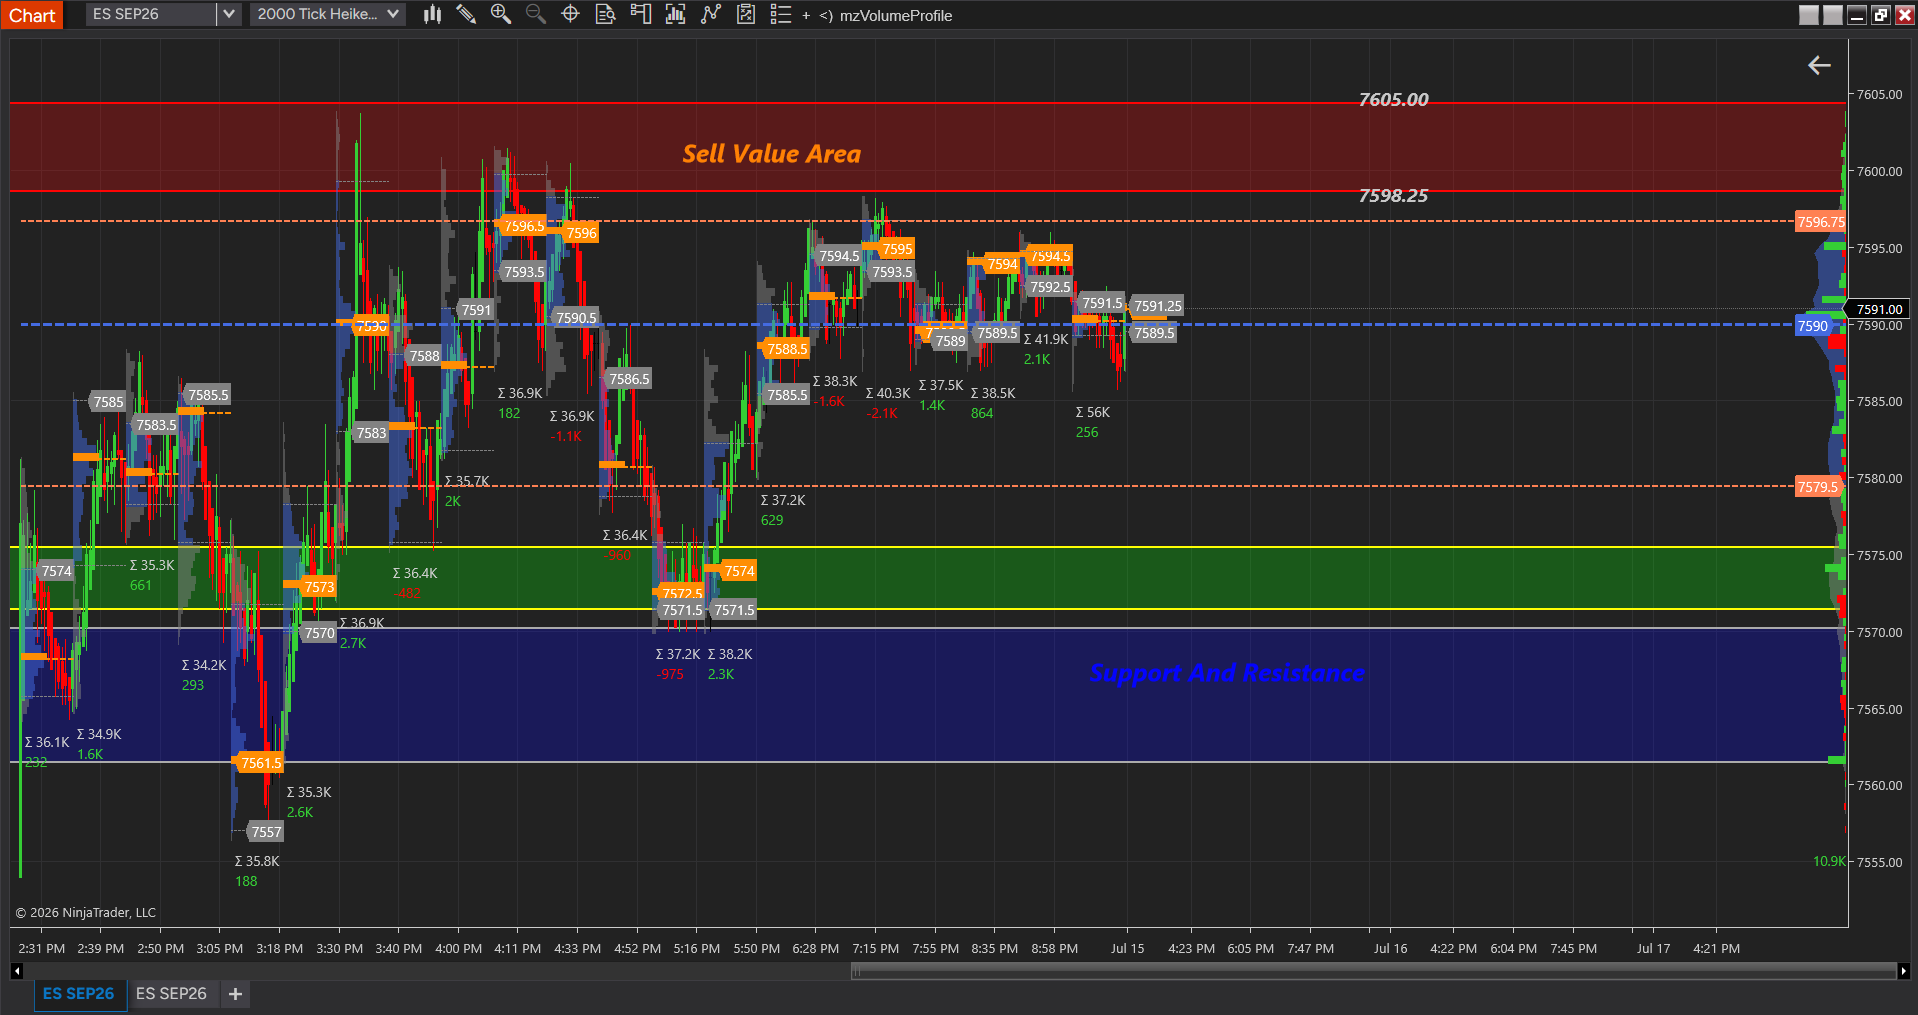
Do not build a setup from price location alone. Wait for acceptance, rejection, or a clear retest around the marked zones before deciding whether the market is transitioning into a new Buy Value Area, continuing lower, or remaining rotational.
Use the map to organize your context, risk, and session plan before looking for a setup.
After a confirmed setup, an illustrative session objective may be between $100 and $200 on MES / ES, depending on contract size, volatility, entry quality, and personal risk limits. This is not a guaranteed result or a personalized profit recommendation.
Our market interpretation is primarily built from Volume Profile and Market Profile. We use auction behavior, acceptance, rejection, value areas, and liquidity structure to explain the current context.
We analyze and trade only during the U.S. session. Avoid using this map as a trading plan for other sessions so the volume, liquidity, and auction context remain clear and consistent.
This map is designed to help you begin the session with a clear idea instead of reacting randomly. The goal is to understand the correct market context, identify the important auction zones, and know which scenarios deserve attention before making any decision. This content is educational only and is not a trade signal.