Important Risk Disclaimer
The content provided on this page, including the Daily Futures Market Map (Pre-NY) and AMT Scenarios,
is shared strictly for educational and informational purposes only.
These market maps, levels, scenarios, and comments are intended to help traders build their own market perspective
and support their personal analysis. They should not be considered financial advice, investment advice, trade signals,
or a guarantee of any market outcome.
Futures, forex, stocks, and other financial markets involve substantial risk and may not be suitable for all investors.
Any trading decision you make is entirely your own responsibility. You should always manage risk carefully and never trade
with capital you cannot afford to lose.
TradingAcademi does not guarantee profits, accuracy of market scenarios, or future results.
Past performance, historical examples, simulated results, or market expectations are not indicative of future performance.

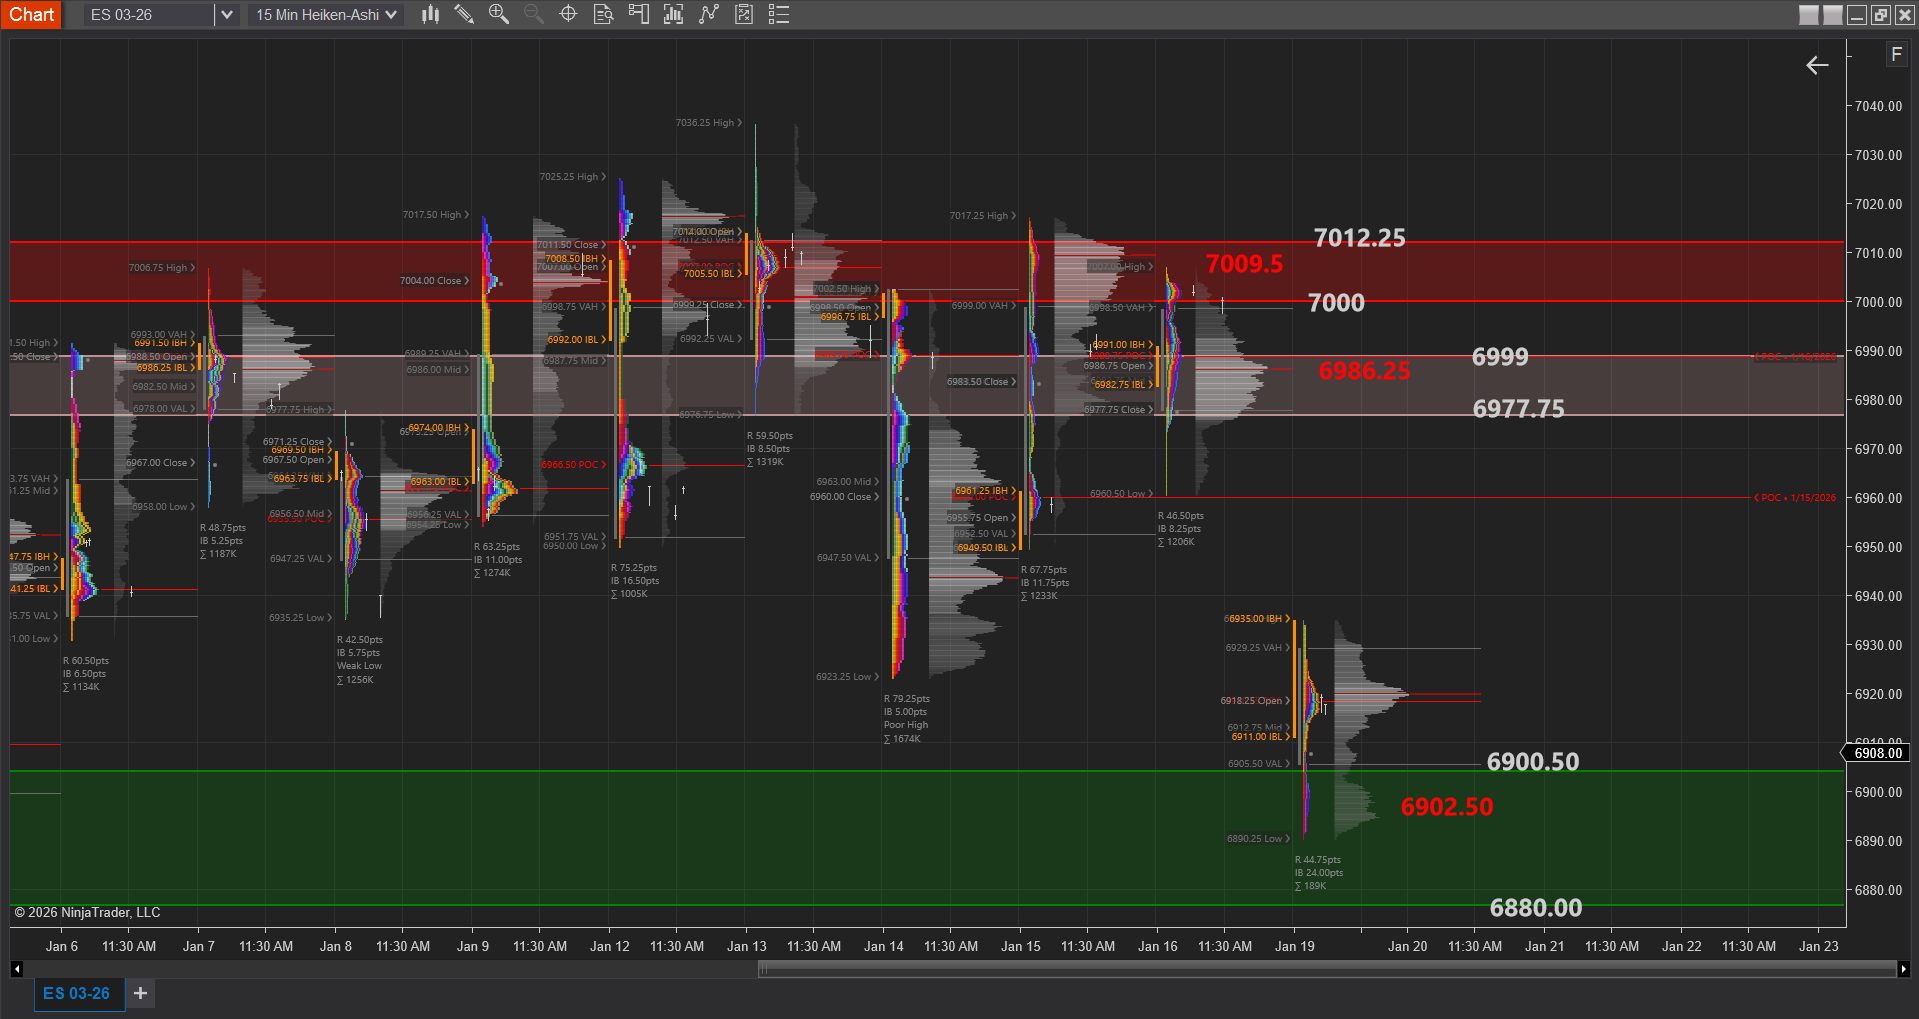
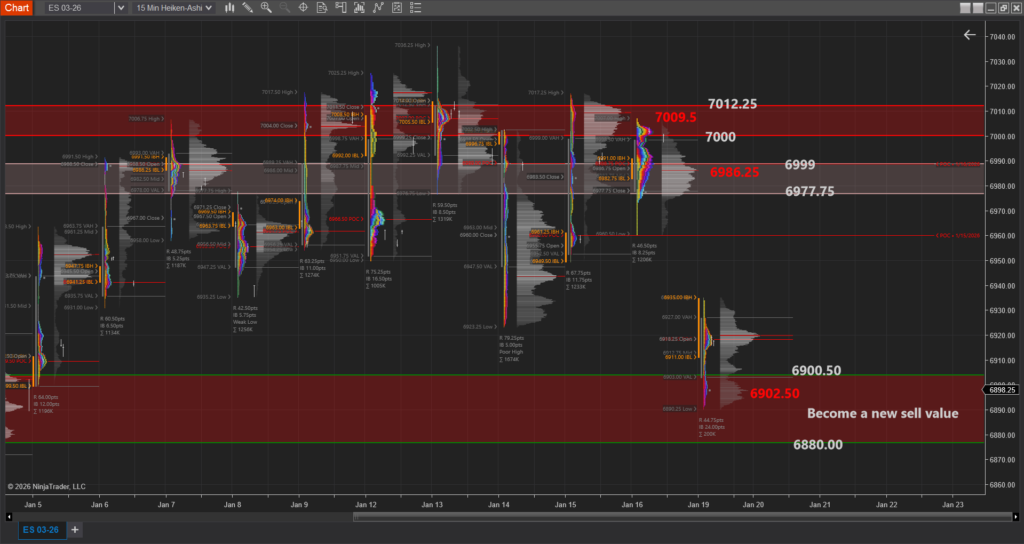
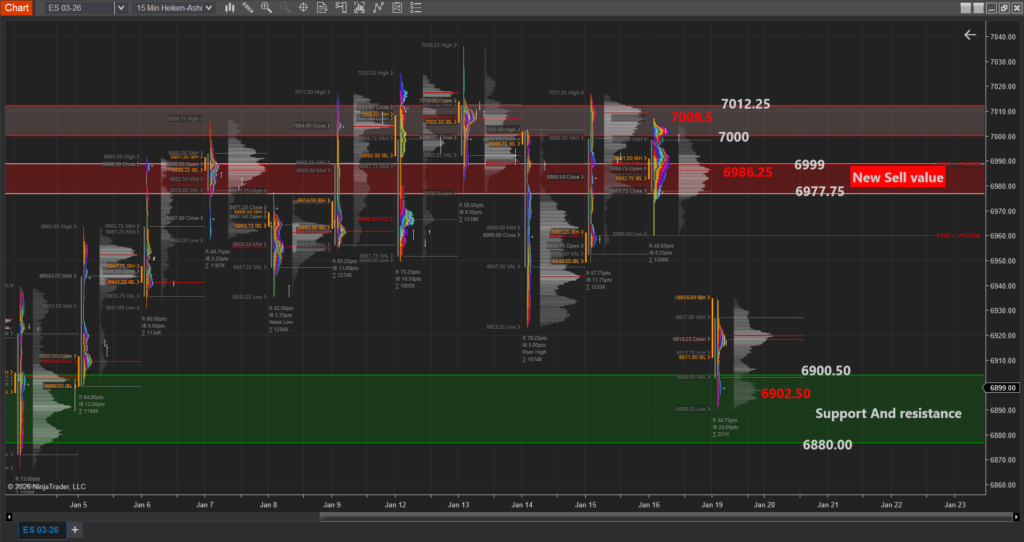
 Uptrend context
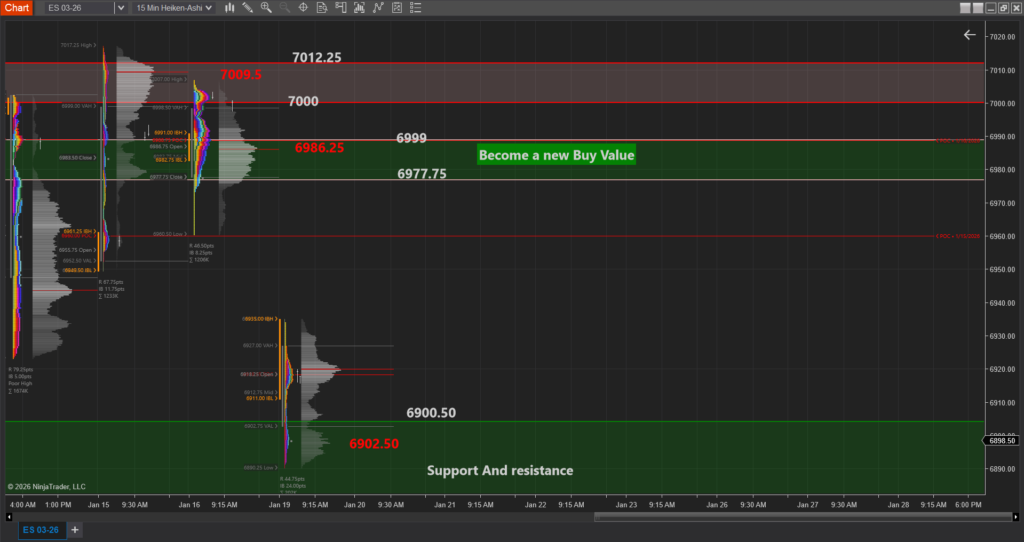
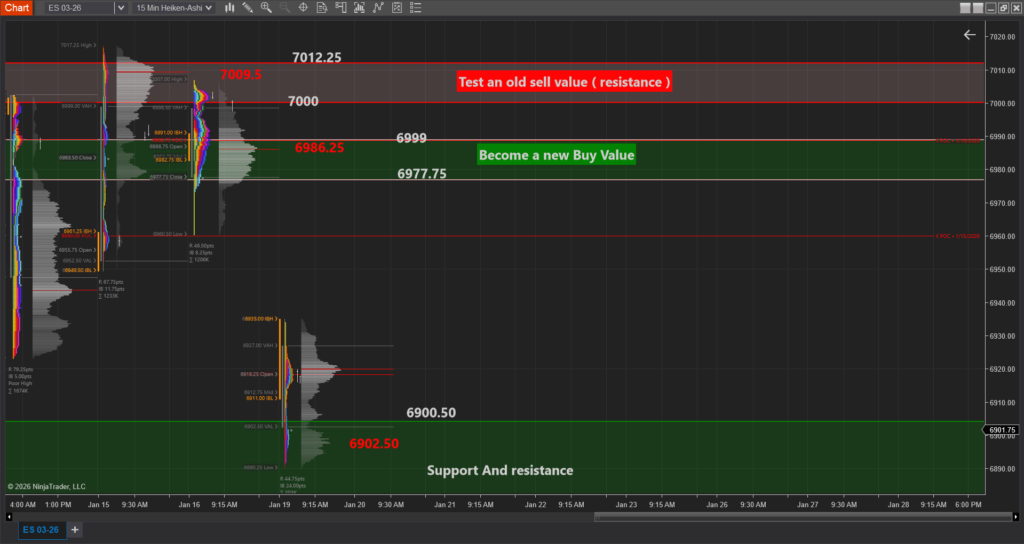