
In the fast-paced world of trading, knowledge isn’t just power—it’s profit. And one of the most important skills you can learn is technical analysis. It allows traders to decode the language of the markets: price action, trends, momentum, and psychology—all hidden in the charts.
This post will take you on a clear, actionable journey through technical analysis with visual references, making it easier than ever to grasp.
What is Technical Analysis?
Technical analysis is the study of historical market data—mainly price and volume—to predict future price movements. Unlike fundamental analysis, which looks at the “why” behind an asset (earnings, news, etc.), technical analysis focuses on the “how”—how price behaves, how trends form, and how patterns repeat.
It assumes that all available information is already reflected in the price and that history tends to repeat itself through recognizable patterns and behaviors.

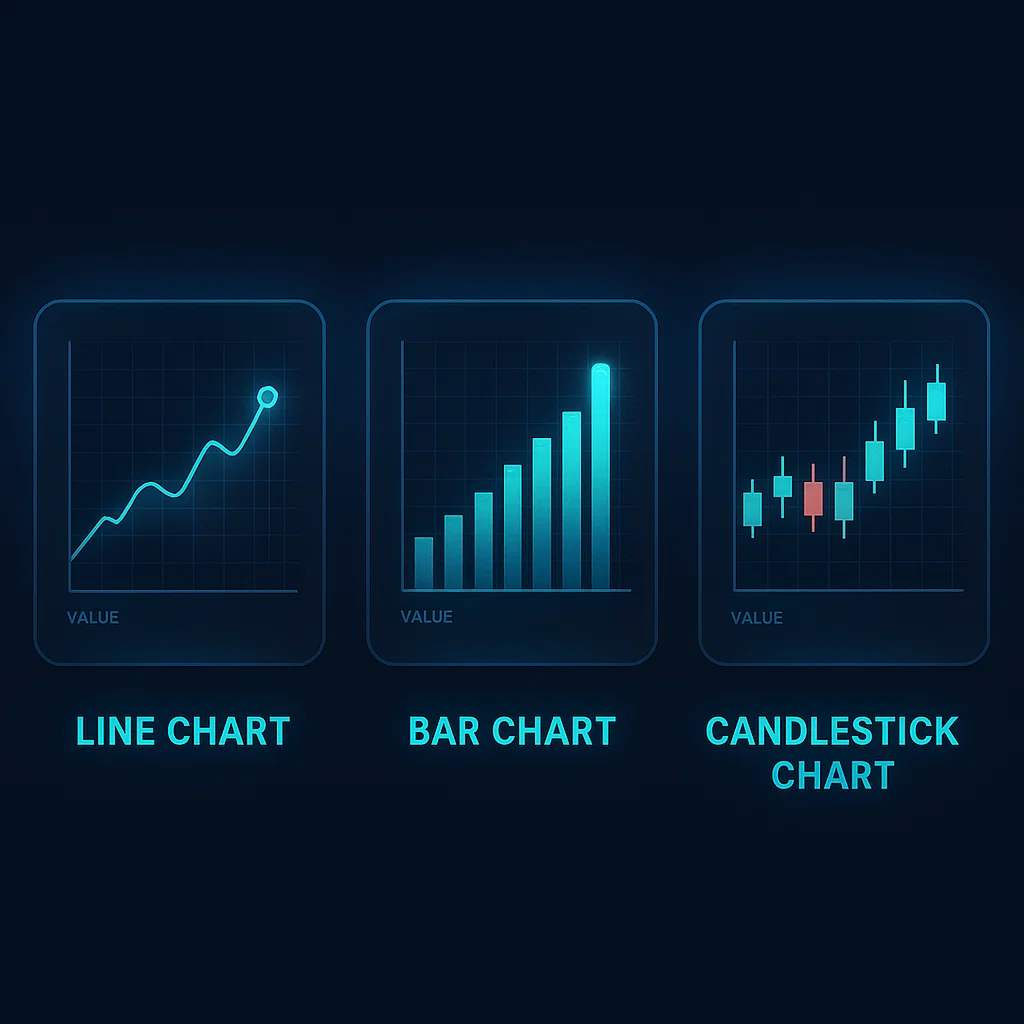
Types of Price Charts
The first thing every technical analyst must understand is the chart—your trading battlefield.
- Line Chart: Connects closing prices over time, best for clarity and simplicity.
- Bar Chart: Shows open, high, low, and close for each period. Useful for more detail.
- Candlestick Chart: The most popular type. Each candle shows a story of buying and selling pressure, often forming visual patterns that can signal continuation or reversal.
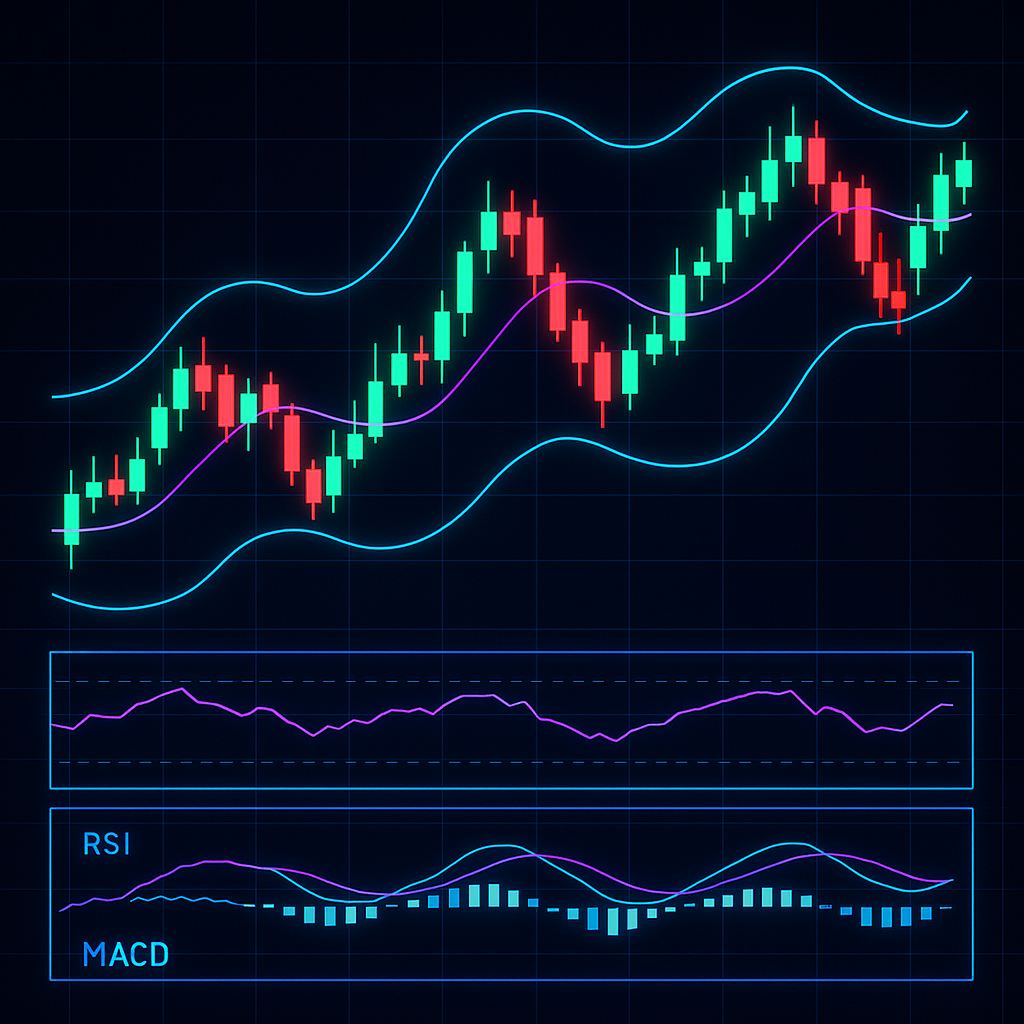
Technical Indicators Explained
Indicators help filter out noise and give traders mathematical tools to support their decisions.
- Moving Averages (SMA, EMA): Show the average price over a specific time. Useful for identifying trends.
- RSI (Relative Strength Index): Shows if an asset is overbought or oversold. Values above 70 = overbought, below 30 = oversold.
- MACD: Measures momentum and trend changes.
- Bollinger Bands: Show volatility and potential reversal zones.
Support and Resistance Levels
Support is a price level where buyers step in. Resistance is where sellers take over. These levels act like psychological barriers in the market and are crucial for entries and exits.
For example, if the price consistently bounces off $100, that’s a support level. If it keeps rejecting $120, that’s resistance.
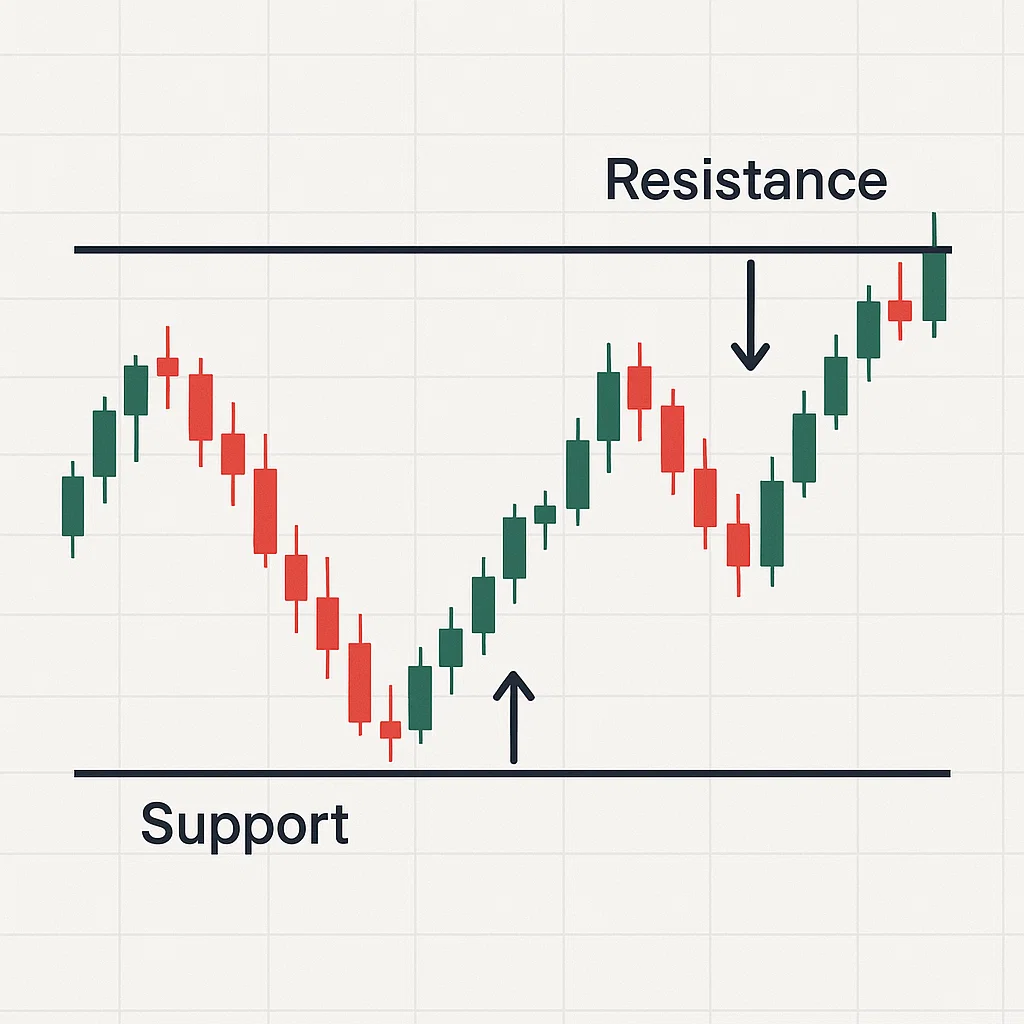
Chart Patterns and Formations
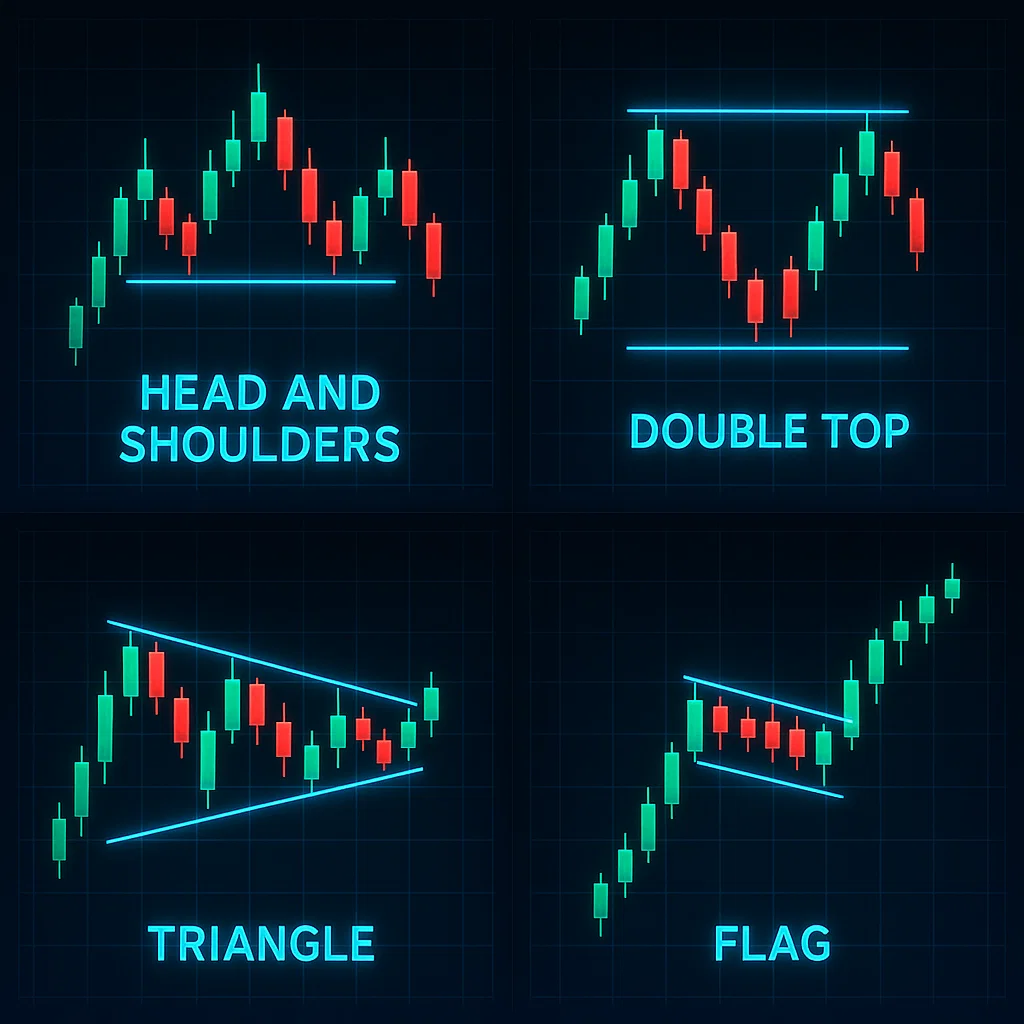
Patterns are the “words” of the technical analysis language. Recognizing them can give you early signals on potential price direction.
- Head and Shoulders: Signals reversal.
- Double Top/Bottom: Also indicates reversal.
- Triangles, Flags, Pennants: Indicate continuation after consolidation.
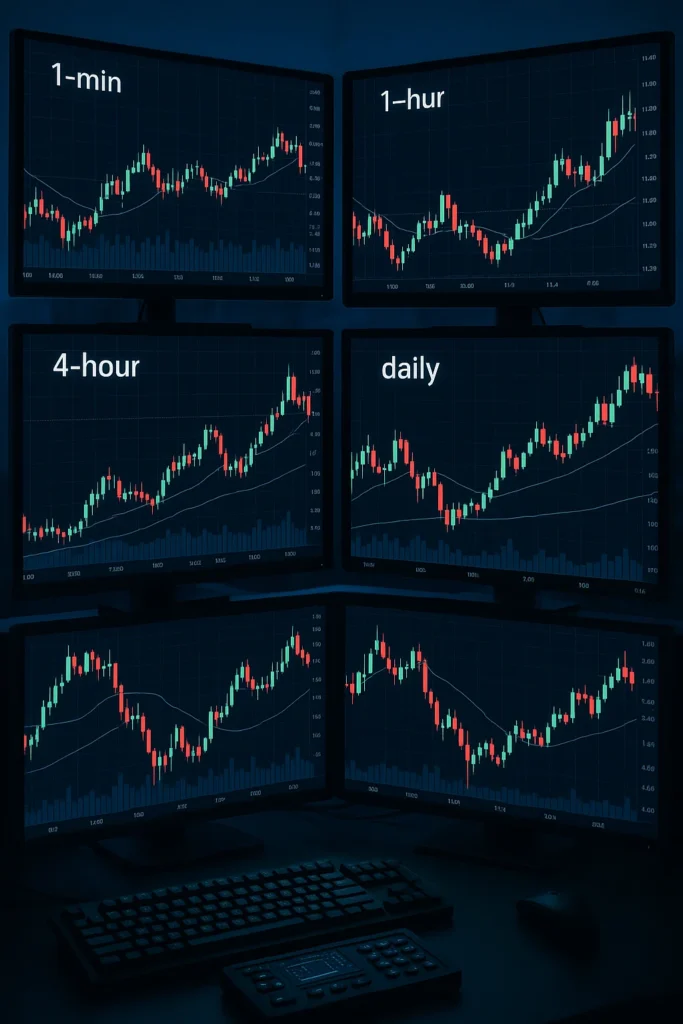
Time Frames and Market Context
The time frame you use depends on your trading style:
- Scalpers: 1-min to 5-min charts.
- Day traders: 15-min to 1-hour.
- Swing traders: 4-hour to daily charts.
- Investors: Weekly and monthly charts.
Always analyze multiple time frames for confirmation.
Price Action vs Indicators
Some advanced traders rely solely on price action—analyzing raw candles, wicks, and structure. They read momentum, market intent, and liquidity zones with no indicators.
Others combine both: indicators for confirmation, price action for precision.

Final Thoughts: Become a Market Reader
Technical analysis turns the market from chaos into structure. It’s not about predicting every move—but about stacking probabilities in your favor. Combine it with solid risk management and discipline, and you’ve got a professional edge.