
Entering the world of trading can be overwhelming, especially when you’re faced with unfamiliar jargon. Whether you’re trading stocks, forex, or crypto, understanding key terms is essential for making informed decisions. This post breaks down the most important trading terminology every beginner should know.
1. Bid and Ask
- Bid: The highest price a buyer is willing to pay for an asset.
- Ask (or Offer): The lowest price a seller is willing to accept.
- The difference between the two is known as the spread.
2. Bull Market vs. Bear Market
- Bull Market: A market that is rising or expected to rise. Traders are optimistic.
- Bear Market: A market that is falling or expected to fall. Traders are pessimistic.
3. Leverage
Leverage allows you to control a larger position with a smaller amount of capital. For example, using 10:1 leverage, you can trade $10,000 with only $1,000. While it can amplify profits, it also increases risk.
4. Long vs. Short
- Going Long: Buying an asset expecting its price to rise.
- Going Short: Selling an asset you don’t own, hoping to buy it back at a lower price.
5. Liquidity
Liquidity refers to how easily an asset can be bought or sold without affecting its price. Highly liquid markets like forex have lots of buyers and sellers at all times.
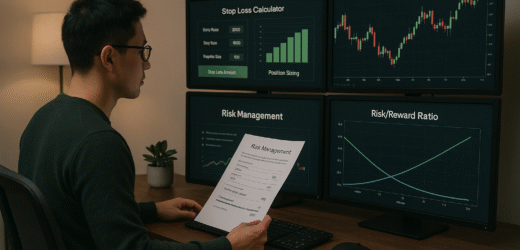
6. Stop Loss and Take Profit
- Stop Loss (SL): Automatically closes a trade at a certain loss level to protect your capital.
- Take Profit (TP): Automatically closes a trade once it reaches a specific profit level.
7. Technical vs. Fundamental Analysis
- Technical Analysis: Uses charts, patterns, and indicators to predict price movements.
- Fundamental Analysis: Evaluates economic, financial, and news data to determine the value of an asset.
8. Volatility
Volatility measures how much an asset’s price moves in a given time period. High volatility = more risk, but also more opportunity.
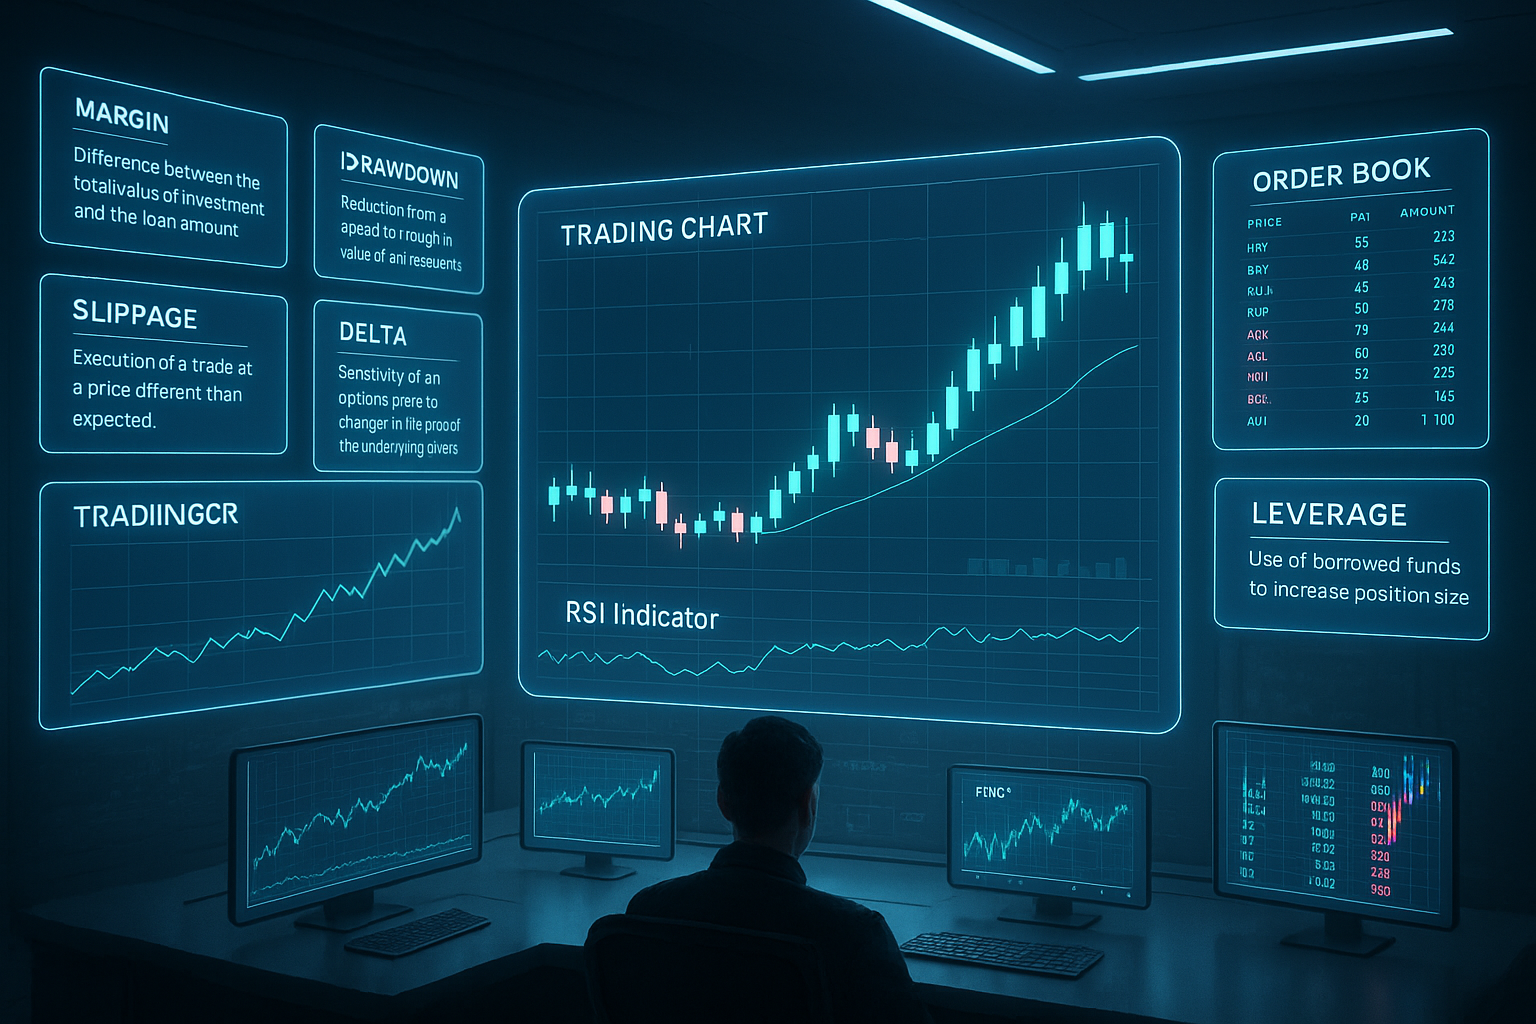
9. Margin
The amount of money a trader must deposit to open and maintain a leveraged position. Trading on margin increases both potential gains and losses.
10. Drawdown
The reduction from a portfolio’s peak value to its lowest point during a specific period. A key metric for assessing risk and strategy performance.
11. Slippage
The difference between the expected price of a trade and the actual price at which it is executed, often due to market volatility or low liquidity.
12. Risk-Reward Ratio
A metric comparing potential profit (reward) to potential loss (risk). A common guideline is a minimum 1:2 risk-reward ratio.
13. Time Frame
The duration of each candlestick or bar on a chart. Common time frames include 1-minute, 5-minute, hourly, daily, weekly, etc. Time frames help determine trading style (scalping, day trading, swing trading, etc.).
14. Overbought & Oversold
Overbought: When an asset is considered too expensive or due for a pullback.
Oversold: When an asset is undervalued or due for a bounce. Commonly identified using indicators like RSI or Stochastic.
15. Order Types
- Market Order: Executes immediately at the current price.
- Limit Order: Executes at a specific price or better.
- Stop Order: Becomes a market order once a price threshold is hit.
- Stop-Limit Order: Combines features of stop and limit orders.
16. Volume
The number of shares or contracts traded during a specific time period. High volume often confirms the strength of a price movement.
17. Hedging
A strategy used to reduce the risk of adverse price movements, often by taking an offsetting position in a related asset.
18. Divergence
Occurs when the price of an asset moves in the opposite direction of an indicator (like RSI or MACD). A signal of a potential reversal.
19. Backtesting
The process of testing a trading strategy using historical data to see how it would have performed.
20. Algorithmic Trading
The use of automated systems and pre-programmed instructions (algorithms) to execute trades based on criteria like price, volume, or timing.
21. Delta (Options & Order Flow)
Measures the sensitivity of an option’s price to a $1 change in the price of the underlying asset. In order flow trading, delta refers to the difference between aggressive buying and selling volumes.
22. Liquidity Trap
A situation where an asset appears liquid but suddenly becomes hard to sell without affecting price—often seen during flash crashes or low-volume periods.
23. Market Depth / Level 2 Data
Provides insight into the supply and demand at different price levels in the market. Useful for active traders and scalpers.
Conclusion
Mastering trading terminology is the first step to becoming a confident trader. With a solid understanding of the basics, you’ll be better prepared to analyze markets, manage risk, and develop your own strategies.
Source:
This article was inspired by and adapted from educational content on Investopedia, one of the most trusted sources for financial definitions and trading concepts.