
What Is RSI in Trading?
The Relative Strength Index (RSI) is a momentum oscillator that helps traders identify overbought or oversold conditions in a market. Developed by J. Welles Wilder Jr., RSI measures the speed and change of price movements, offering critical insights into market strength or weakness.
Definition and Formula
RSI is calculated using the formula:
RSI = 100 – [100 / (1 + RS)]
Where RS = Average Gain over N periods / Average Loss over N periods
By default, most charting platforms use a 14-period RSI.
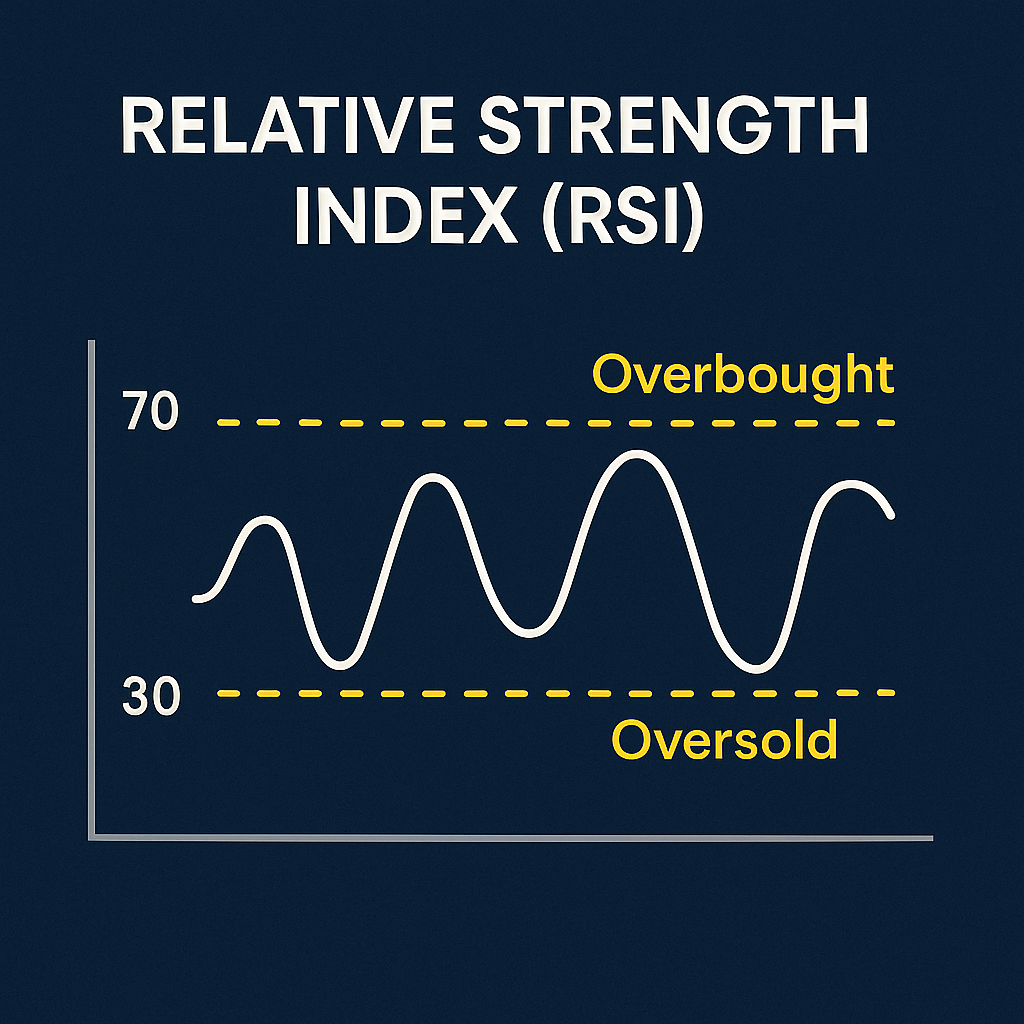
Understanding the RSI Scale (0 to 100)
RSI values range from 0 to 100, and its movement reflects bullish or bearish momentum:
- Values above 70 suggest a market is potentially overbought
- Values below 30 suggest it may be oversold
What RSI Tells You About Momentum
- Rising RSI = Increasing buying pressure
- Falling RSI = Increasing selling pressure
It’s not just about extremes. RSI also shows how quickly price is moving and whether it’s accelerating or weakening.
Key RSI Thresholds Explained
Overbought (Above 70) and Oversold (Below 30)
- Overbought doesn’t mean “sell now.” It signals that price may be extended upward and due for a pullback.
- Oversold doesn’t mean “buy immediately.” It means price is extended downward and may soon rebound.
What Happens at RSI 50?
The midline (50) acts as a neutral zone:
- Above 50 = bullish bias
- Below 50 = bearish bias
Many traders use RSI crossing 50 to confirm trend shifts.
Divergence Between Price and RSI
Divergence occurs when price makes a new high or low, but RSI doesn’t confirm it. This can hint at a possible reversal:
- Bearish divergence: Price rises, RSI falls
- Bullish divergence: Price drops, RSI rises
Popular RSI Trading Strategies
RSI Reversal Strategy (Overbought/Oversold Bounces)
Buy when RSI < 30 and starts turning up
Sell when RSI > 70 and starts turning down
Use with confirmation from support/resistance levels or candlestick patterns.
RSI Trend-Following Strategy
In a bull trend, RSI may stay above 40–50
In a bear trend, RSI may remain under 60–50
Instead of fading RSI extremes, trade with trend direction.
RSI with Support and Resistance
RSI becomes more powerful when used near key support or resistance zones:
- RSI < 30 near support? Look for reversal buy.
- RSI > 70 near resistance? Consider short setups.
Combining RSI with Other Indicators
RSI + Moving Averages
Use a moving average (e.g., 200 EMA) to define trend. Only take RSI signals in the direction of the trend.
RSI + MACD
Combine RSI’s momentum with MACD’s trend confirmation for stronger signals.
RSI + Candlestick Patterns
Look for engulfing candles, pin bars, or inside bars near RSI extremes for high-probability entries.
Timeframes and RSI Settings
Default 14-Period RSI
Most traders start with this setting it offers a balance of sensitivity and stability.
RSI for Scalping vs Swing Trading
- Scalping: Use faster RSI (2, 5, or 7 period)
- Swing Trading: Stick with 14 or 21 period RSI for broader signals
Custom RSI Settings (2, 5, 7 Periods)
Shorter RSI settings offer more signals but can lead to more noise. Ideal for advanced traders who need quicker confirmation.
Common Mistakes When Using RSI
Relying Only on RSI to Enter Trades
RSI is a supporting tool, not a full system. Combine with price action, volume, or other indicators.
Ignoring Market Context
RSI signals in strong trends can be misleading. In bull runs, RSI can stay overbought for days or weeks.
Overtrading During Consolidation
RSI whipsaws during sideways action. Use wider thresholds or avoid range-bound markets altogether.
Best Markets and Conditions for RSI
RSI in Ranging Markets
RSI performs best in sideways or range-bound markets—perfect for catching reversal setups.
RSI in Trending Markets
In trends, RSI works better for pullback confirmation, not reversals. Consider adjusting threshold levels (e.g., 80/20 instead of 70/30).
FAQs on RSI in Trading
Is RSI good for beginners?
Yes. It’s simple, visual, and highly effective when combined with a trading plan.
Does RSI work for crypto?
Absolutely. RSI is widely used in crypto markets across all timeframes.
What’s the best RSI setting?
There’s no “best,” but 14-period RSI is a solid default. Customize based on your strategy and timeframe.
Can RSI predict breakouts?
RSI divergence and failure swings can hint at upcoming breakouts, but they’re not foolproof.
Is RSI more reliable than MACD?
They serve different purposes. RSI is better for momentum extremes; MACD is better for trend following.
Mastering RSI for Better Timing and Risk Control
The Relative Strength Index is one of the most powerful yet misunderstood tools in a trader’s toolkit. Whether you’re a day trader or long-term investor, mastering RSI helps you gauge momentum, spot reversals, and time entries with more confidence.
But remember: RSI isn’t a crystal ball. It shines brightest when paired with context, discipline, and strategy.