
While technical analysis focuses on charts and price patterns, fundamental analysis digs into the core of what makes a financial asset valuable. It’s the method of evaluating securities by examining economic, financial, and qualitative data to determine their intrinsic value.
In this guide, we’ll explore the pillars of fundamental analysis, tools used by professionals, and how to blend it with technical analysis for superior trading results.
What is Fundamental Analysis?
Fundamental analysis aims to determine the true value of an asset, whether it’s a stock, currency, or commodity. If the market price is below this “intrinsic value,” the asset is considered undervalued—a potential buy. If it’s overpriced, it might be time to sell or short.

Key Components of Fundamental Analysis
There are three layers of fundamental analysis:
- Economic Analysis: Evaluates the health of an economy.
- Industry Analysis: Looks at industry trends, competition, and regulation.
- Company/Asset-Specific Analysis: Involves balance sheets, income statements, and cash flows.

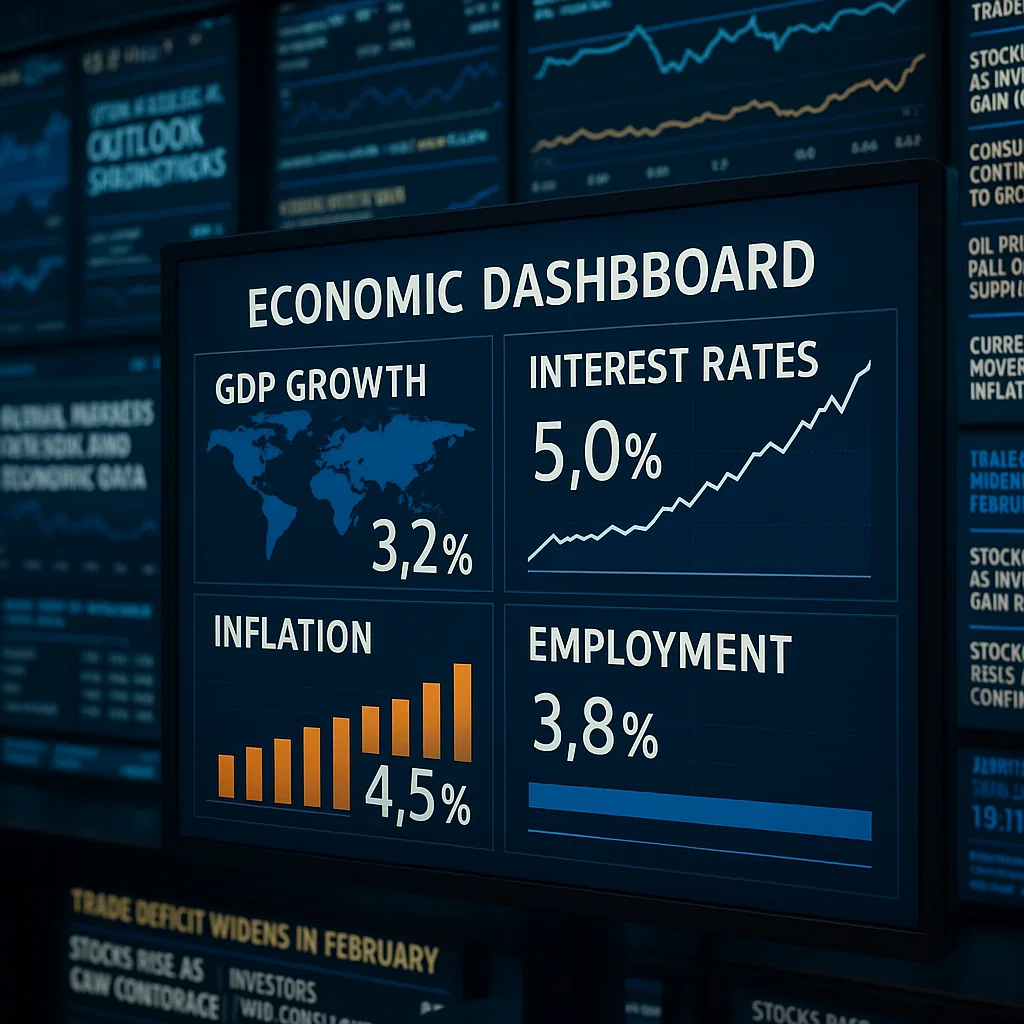
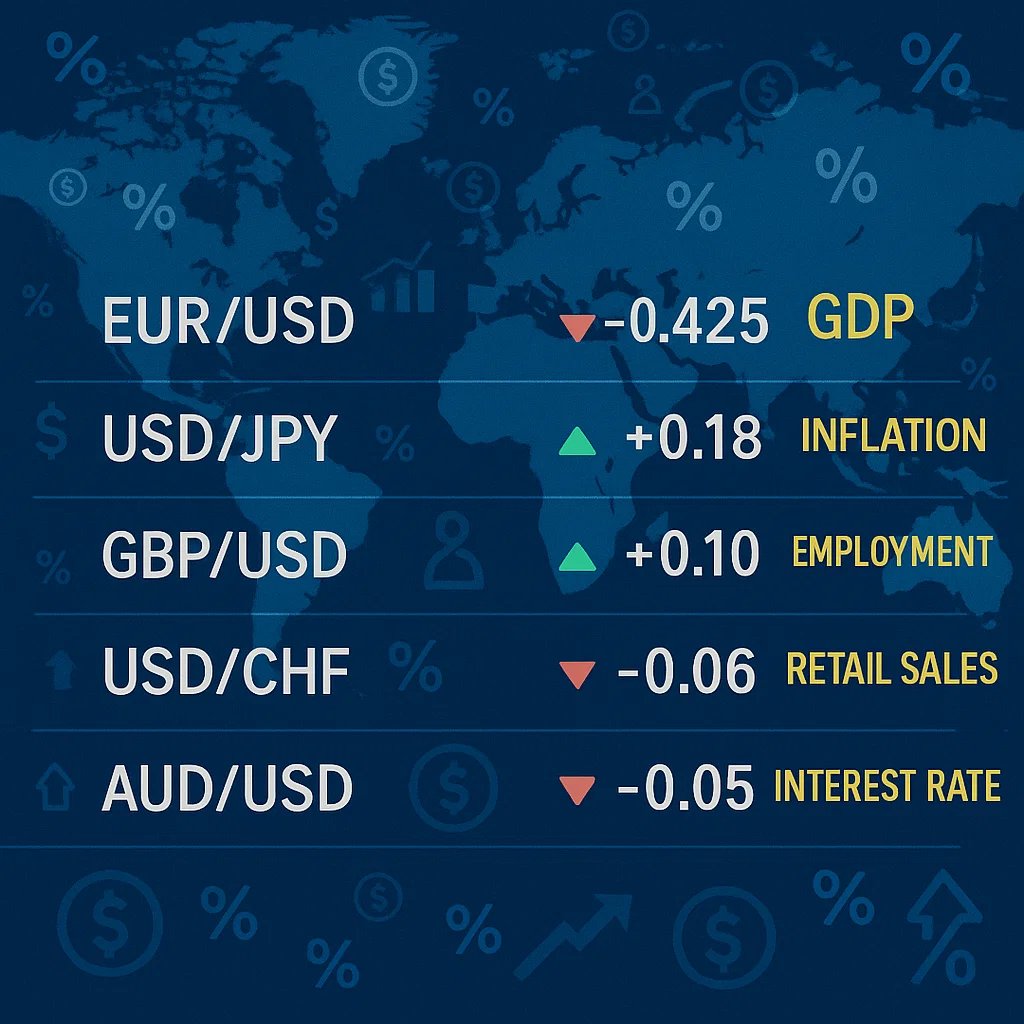
Macroeconomic Indicators to Watch
For forex and global markets, macro data drives everything. Key indicators include:
- GDP (Gross Domestic Product): Measures overall economic performance.
- Unemployment Rates: Shows labor market strength.
- Interest Rates: Central bank policies heavily influence asset prices.
- Inflation (CPI/PPI): Affects currency strength and consumer power.
Central Banks and Monetary Policy
No fundamental analyst can ignore central banks. Institutions like the Federal Reserve (USA), ECB (Europe), and BOJ (Japan) set interest rates and control money supply.
Their tools include:
- Rate hikes/cuts
- Quantitative easing
- Forward guidance

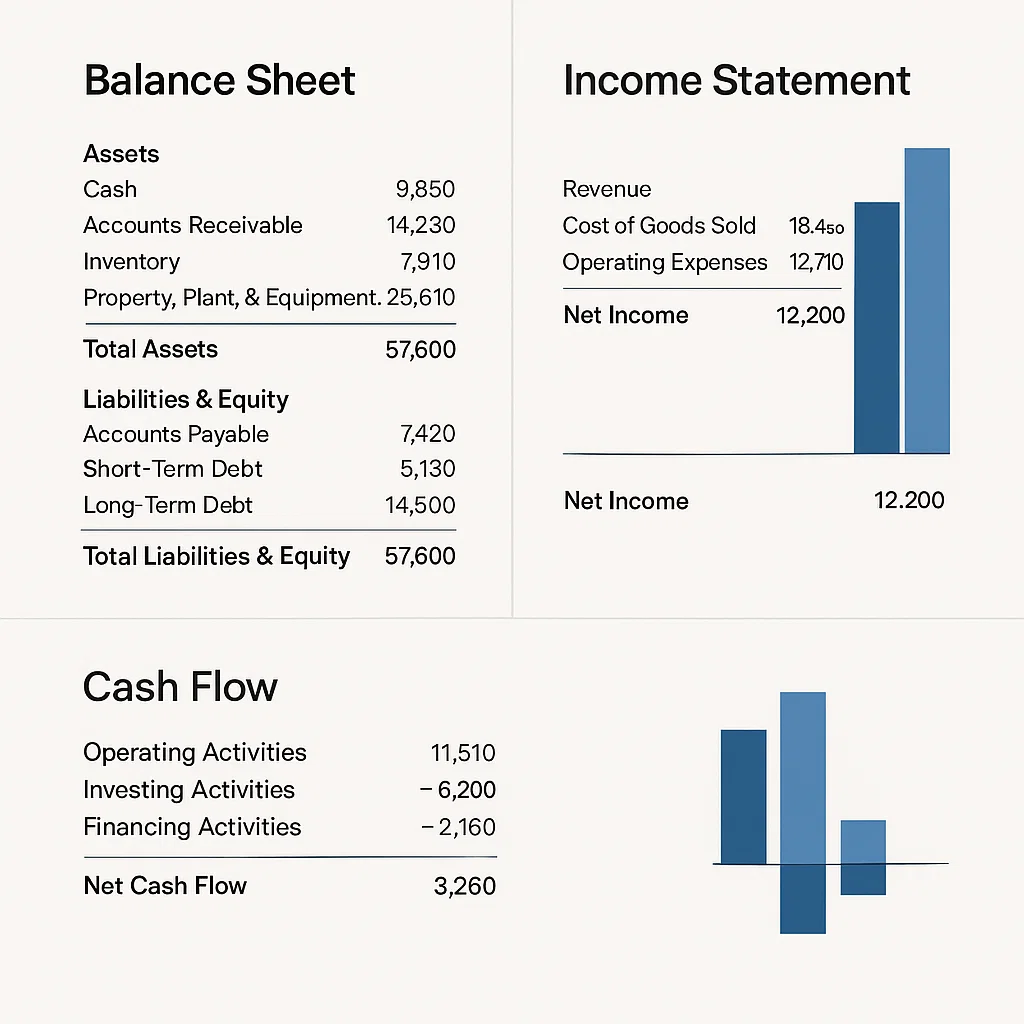
Company Financial Statements
For stock trading, company health is key. The three most important documents:
- Balance Sheet: Snapshot of assets vs liabilities.
- Income Statement: Shows profit and loss.
- Cash Flow Statement: Tracks money in and out.
Earnings Reports and Forecasts
Earnings season is when companies announce profits, forecasts, and surprises. Traders use:
- EPS (Earnings Per Share)
- Revenue
- Forward Guidance
- Earnings Calls
These events often move stock prices dramatically.

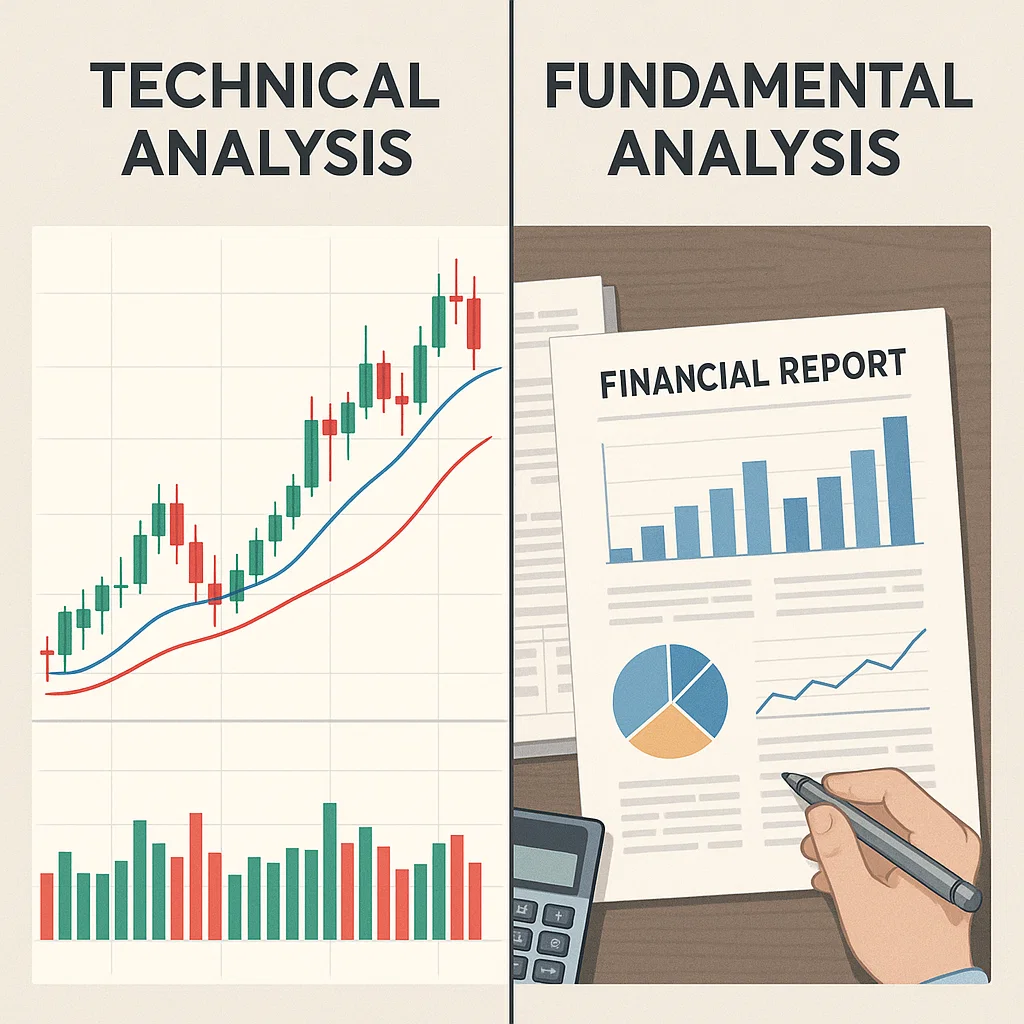
Comparing Fundamental vs Technical Analysis
| Feature | Fundamental Analysis | Technical Analysis |
|---|---|---|
| Focus | Intrinsic value | Price movement |
| Data Used | Financials, macro trends | Charts, indicators |
| Timeframe | Long-term | Short-term to mid-term |
| Tools | Reports, ratios | Patterns, oscillators |
Best traders use both: fundamentals for direction, technicals for timing.
Fundamental Analysis in Forex
Forex traders look at:
- Interest Rate Differentials
- Trade Balances
- Political Stability
- Geopolitical Events
Example: If the U.S. raises interest rates, the USD may strengthen due to higher yield attraction.
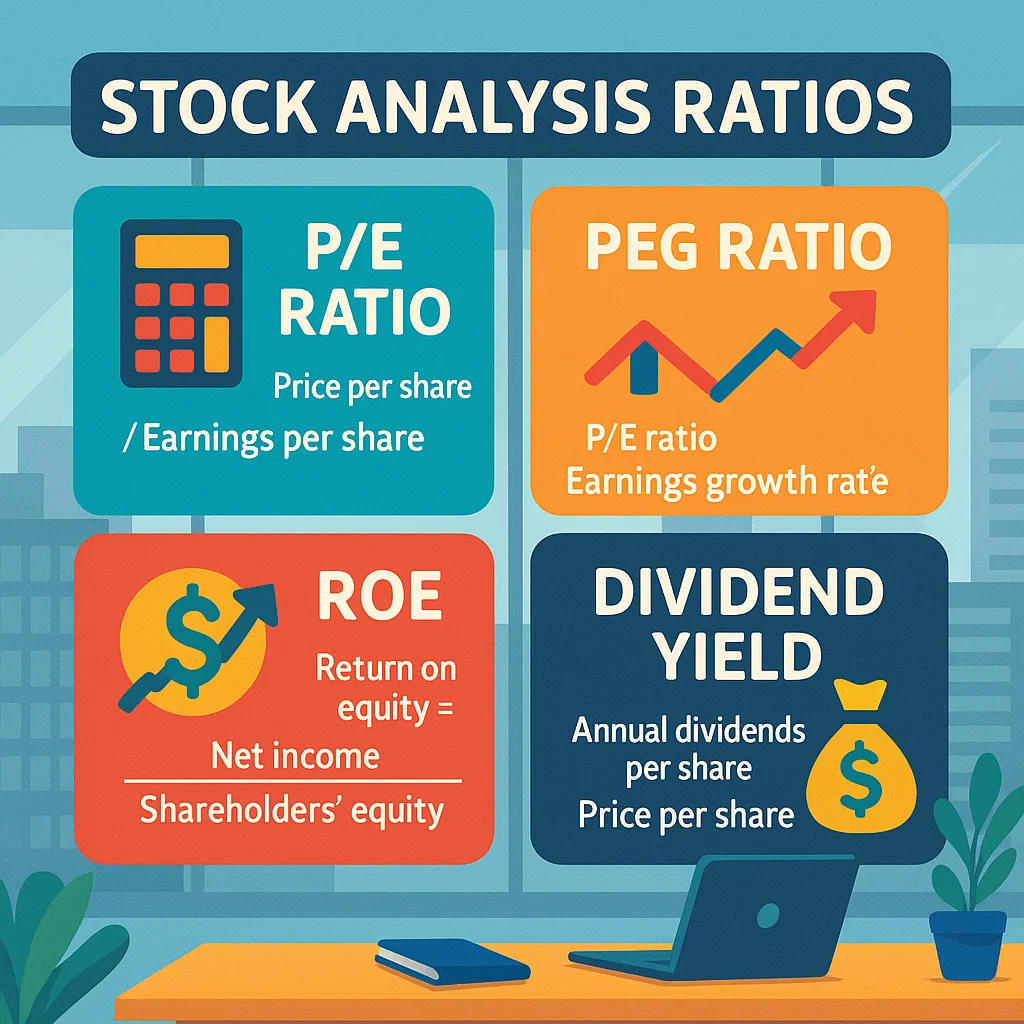
Fundamental Ratios and Metrics
Here are a few critical metrics to evaluate stocks and assets:
- P/E Ratio (Price to Earnings)
- PEG Ratio
- ROE (Return on Equity)
- Debt-to-Equity
- Dividend Yield
Final Thoughts: Think Like an Analyst
Fundamental analysis gives you the why behind the market. It equips you with the bigger picture—helping you trade with conviction, avoid hype, and invest wisely.
For consistent success, blend it with risk management and technical timing, and you’ll build a trading strategy with depth and precision.