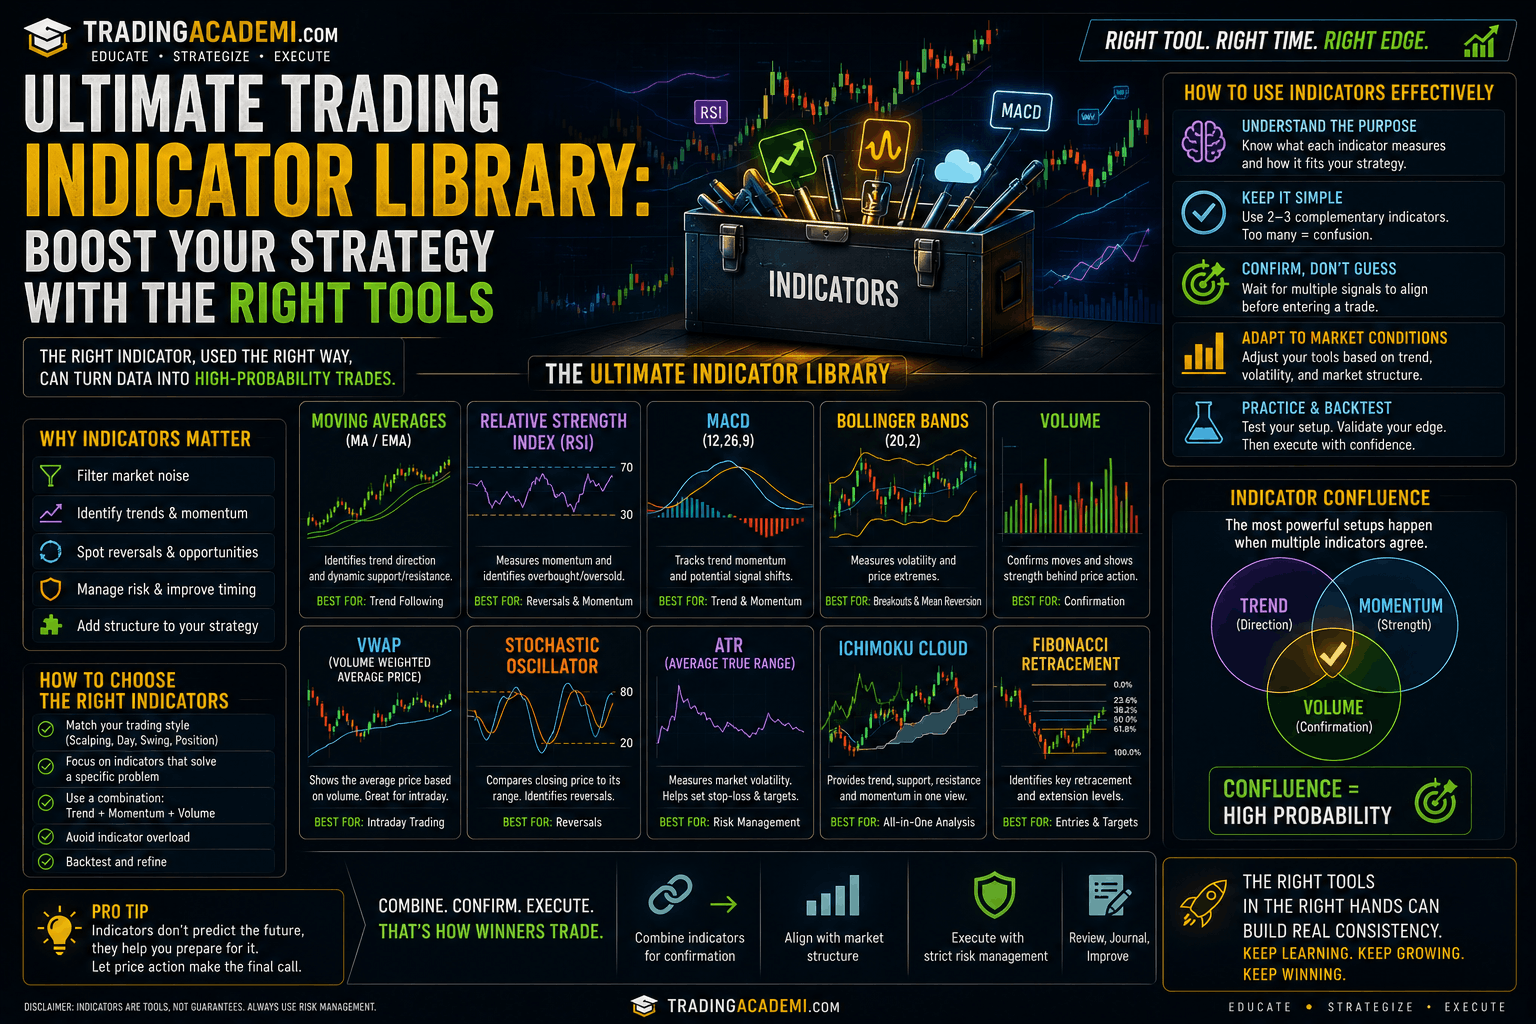
Choosing the right indicators can make or break your trading performance. Whether you’re a beginner or an experienced futures trader, understanding how different indicators work and when to use them is essential. In this post, we’ve curated a complete Indicator Library to guide your strategy, help you filter signals, and make informed trading decisions with confidence.
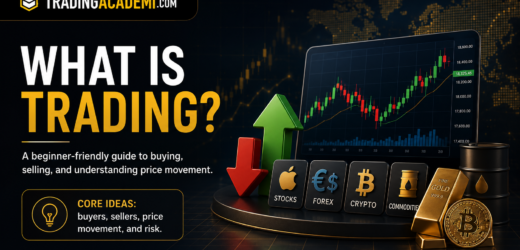
What Is a Trading Indicator?
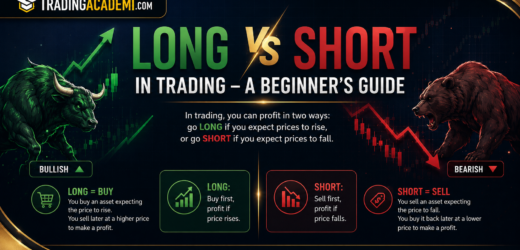
Trading indicators are tools based on mathematical calculations derived from price, volume, or open interest. They help traders identify trends, momentum, volatility, and market structure. Indicators can be used alone or in combination to confirm setups or anticipate reversals.
Categories of Trading Indicators :
Trend-Following Indicators
Moving Averages (SMA, EMA) – Smooth price data to highlight the trend.
MACD (Moving Average Convergence Divergence) – Shows the relationship between two EMAs.
ADX (Average Directional Index) – Measures trend strength without direction.
Momentum Indicators
RSI (Relative Strength Index) – Identifies overbought/oversold conditions..
Stochastic Oscillator – Highlights price momentum and turning points.
CCI (Commodity Channel Index) – Detects cyclical trends.
Volume-Based Indicators
Volume Profile – Shows volume at each price level.
OBV (On-Balance Volume) – Combines volume and price action.
Accumulation/Distribution Line – Detects buying/selling pressure.
Volatility Indicators
Bollinger Bands – Show price deviation from a moving average.
ATR (Average True Range) – Measures market volatility.
Donchian Channels – Highlight recent highs and lows.
Order Flow & Footprint Indicators
Delta (Cumulative, Max, Min) – Shows buying vs. selling pressure – the difference between aggressive buying and selling at each price level.
Footprint Chart – Displays bid/ask volume at each price level.
Volume & Market Auction Indicators
Volume Profile – Displays volume traded at each price level. Useful for identifying key support/resistance zones and value areas..
Market Profile – A time-price opportunity chart that visualizes where and how long the market traded at each level.
VWAP (Volume Weighted Average Price) – Tracks the average price based on volume, helpful for identifying institutional interest.
Custom & Advanced Order Flow Tools
Bid/Ask Volume Imbalance
Iceberg Order Detection
DOM (Depth of Market) Analysis
The best traders don’t just follow indicators—they understand them. This Indicator Library is a living resource to help you make smarter trading decisions with data-driven tools. As we expand it, you’ll gain deeper insight into market behavior and sharpen your edge in futures trading.