
The Moving Average (MA) is one of the most widely used indicators in technical analysis. Its primary role is to smooth out price data, helping traders identify the direction of a trend with more clarity. Whether you’re a beginner or an advanced trader, understanding moving averages is essential for making informed decisions in volatile markets.
What Is a Moving Average?
A moving average is a statistical calculation that averages a selected range of prices, typically closing prices, over a specified number of periods. This average is then plotted on a chart, forming a line that represents the average price movement over time. By doing so, it filters out the “noise” from random price fluctuations and highlights the prevailing trend direction.
Types of Moving Averages
There are several types of moving averages, but the two most commonly used are:
1. Simple Moving Average (SMA)
The SMA is the unweighted average of prices over a given number of periods. It gives equal importance to all price points in the dataset.
Formula:
SMA = (P1 + P2 + ... + Pn) / nWhere P is price and n is the number of periods.
2. Exponential Moving Average (EMA)
The EMA gives more weight to recent prices, making it more responsive to new information and price changes. This makes it more suitable for short-term trading strategies.
Why EMA is preferred:
- Reacts faster to price changes
- Useful for identifying momentum
- Often used in crossover strategies with other EMAs
How to Use Moving Averages in Trading
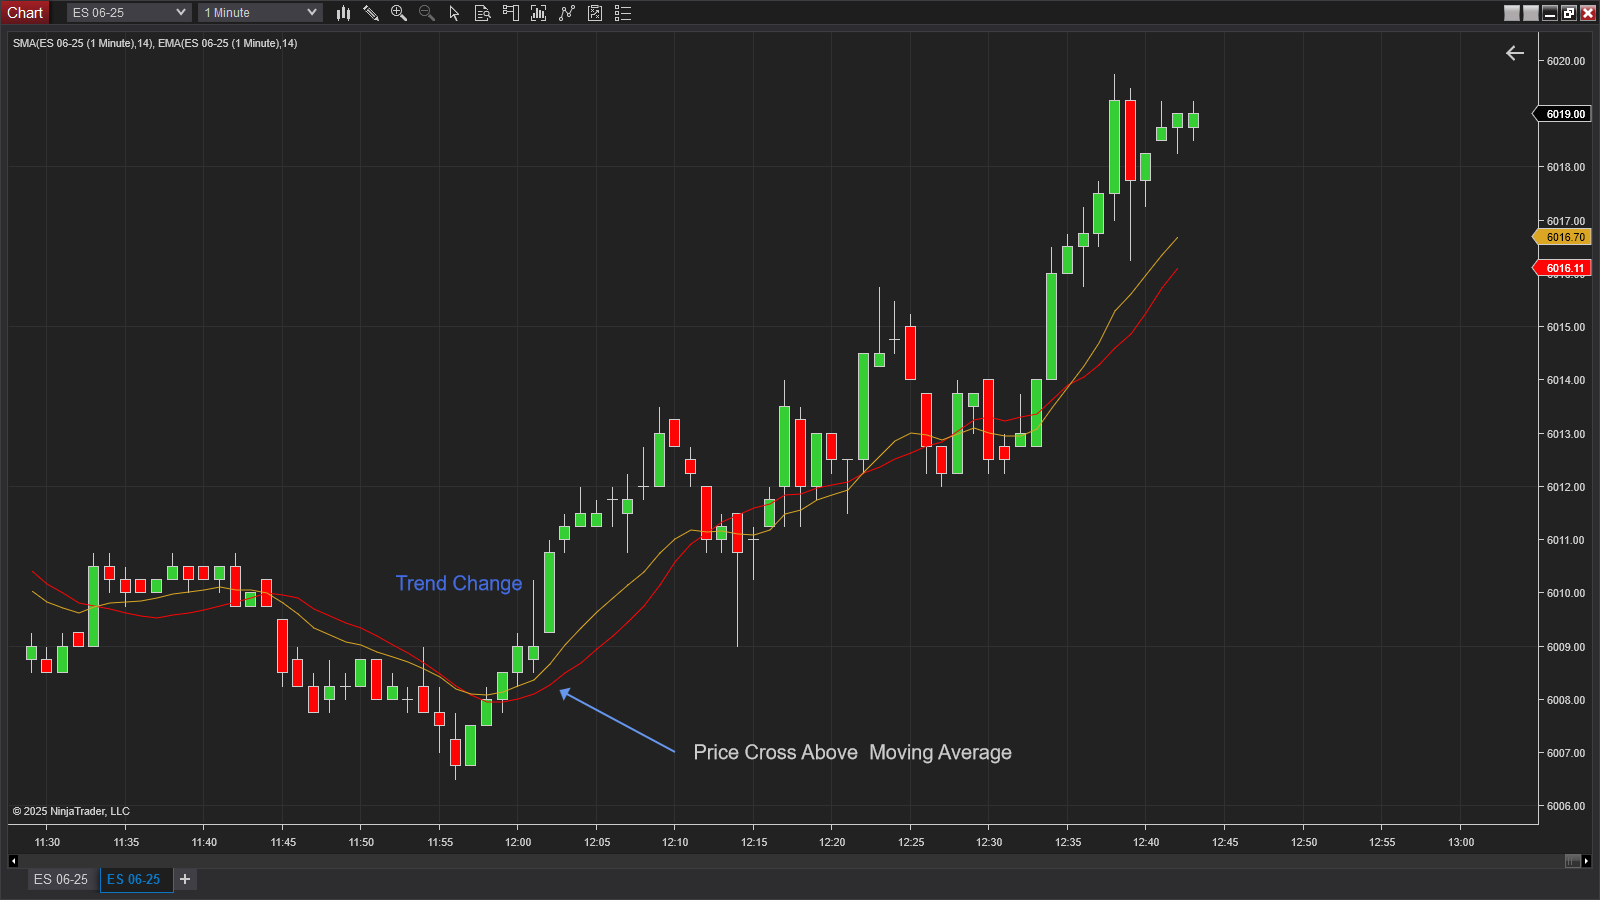
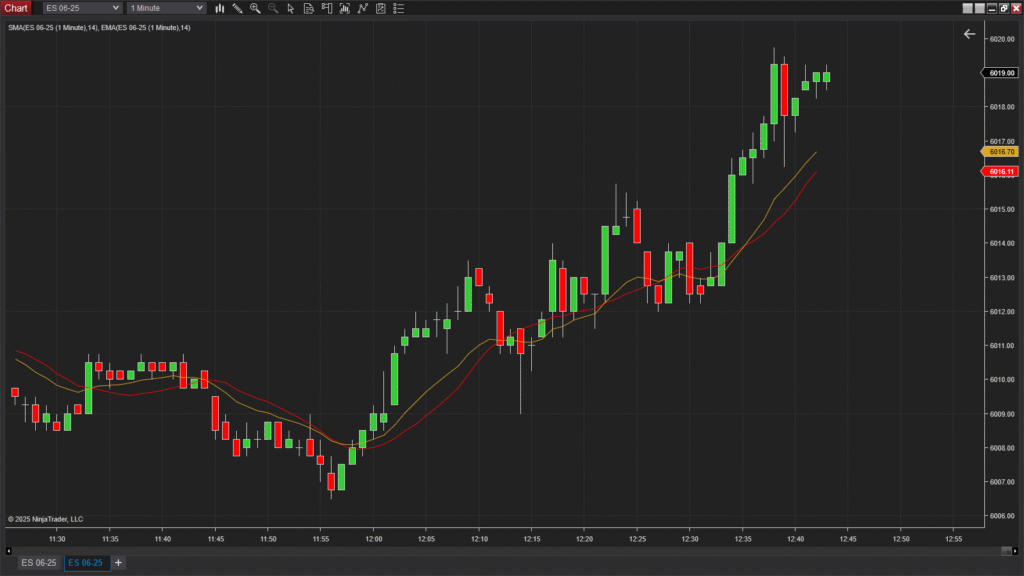
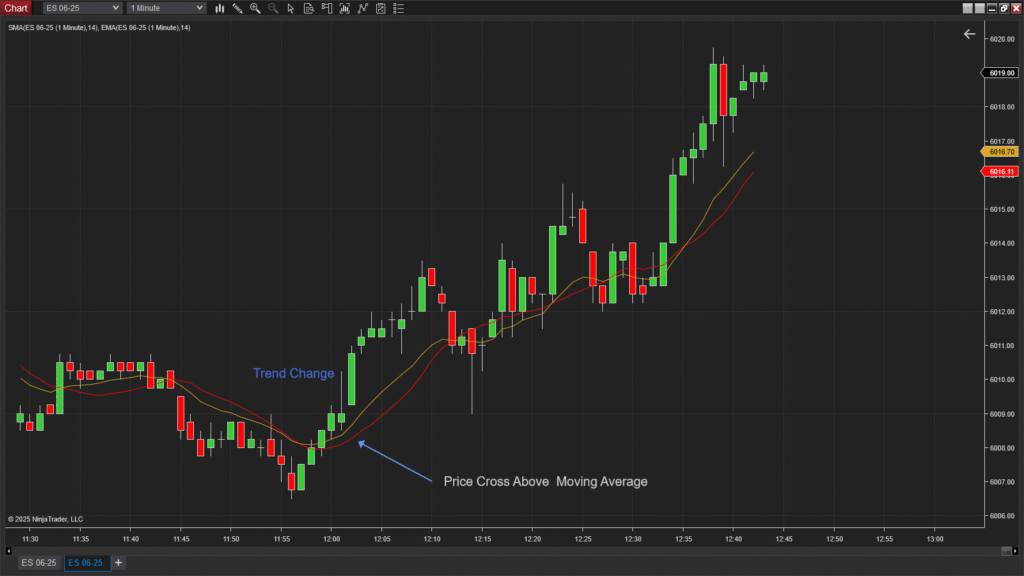
Trend Direction
When the price is above a moving average, it often signals an uptrend. When it’s below, it suggests a downtrend.
Support and Resistance
Moving averages can act as dynamic support or resistance levels. Traders often buy near the moving average in uptrends and sell near it in downtrends.
Crossover Signals
- Bullish crossover: A short-term MA (e.g., 9 EMA) crosses above a long-term MA (e.g., 50 SMA).
- Bearish crossover: A short-term MA crosses below a long-term MA.
These crossovers can signal potential entry or exit points.
Best Settings for Moving Averages
| Strategy Type | Short-Term MA | Long-Term MA |
|---|---|---|
| Day Trading | 9 EMA | 21 EMA |
| Swing Trading | 20 SMA | 50 SMA |
| Trend Following | 50 EMA | 200 EMA |
The best settings depend on your trading style, timeframe, and the asset you are analyzing.
Moving Averages in Combination
Traders rarely use moving averages alone. They’re often combined with:
- RSI (Relative Strength Index)
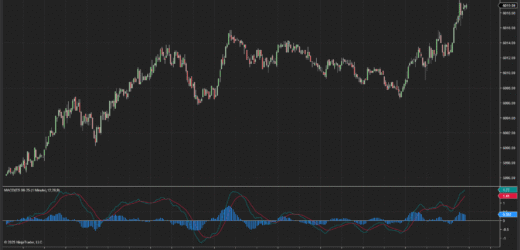
- MACD (Moving Average Convergence Divergence)
- Bollinger Bands
Using multiple tools together allows for more accurate signals and better confirmation of trends or reversals.
Pro Tips for Trading with Moving Averages
- Always adjust your MA settings based on market volatility.
- Backtest your strategy before going live.
- Don’t rely solely on MAs; use them with price action and volume for better results.
- Moving averages lag—be cautious during high volatility or news releases.
Final Thoughts
The Moving Average is a powerful yet simple indicator that can dramatically enhance your trading strategy. Whether you’re identifying trends, filtering trades, or finding support and resistance levels, the MA remains a foundational tool for all technical traders.