
The MACD (Moving Average Convergence Divergence) is one of the most popular and effective indicators in technical analysis. It blends the concepts of trend-following and momentum into a single tool, making it a favorite among traders of all levels. Whether you’re a day trader, swing trader, or long-term investor, understanding how to use MACD can significantly enhance your trading strategy.
What Is the MACD Indicator?
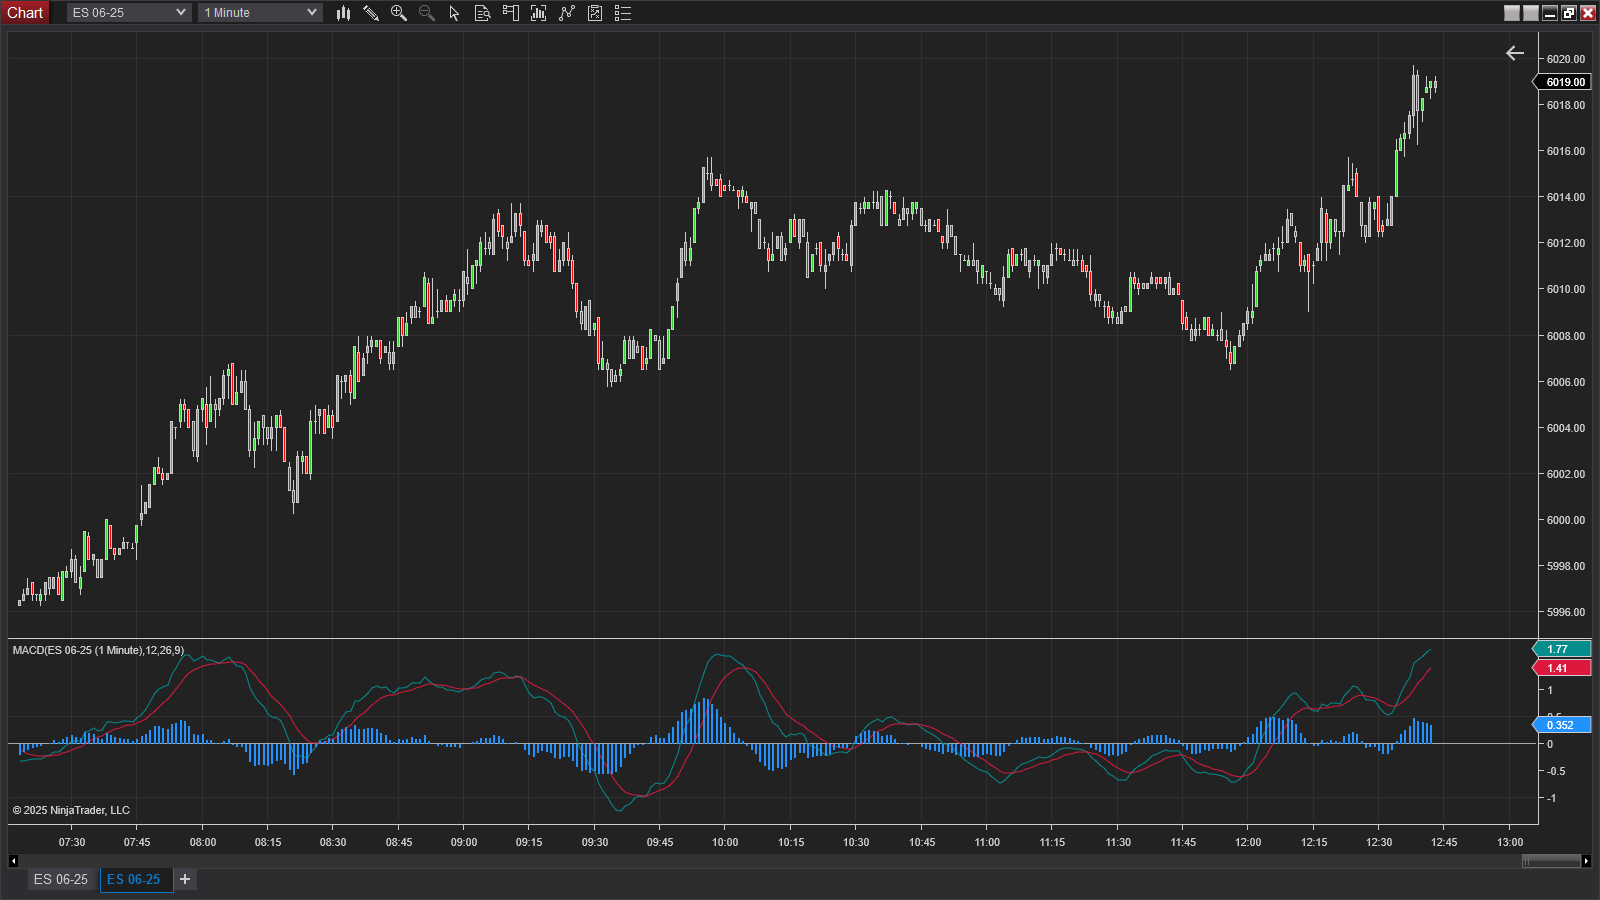
The MACD is a momentum oscillator that shows the relationship between two moving averages of a security’s price. It helps traders identify changes in momentum, trend direction, and potential reversal points.
MACD Formula:
MACD Line = 12 EMA – 26 EMA
Signal Line = 9 EMA of MACD Line
MACD Histogram = MACD Line – Signal Line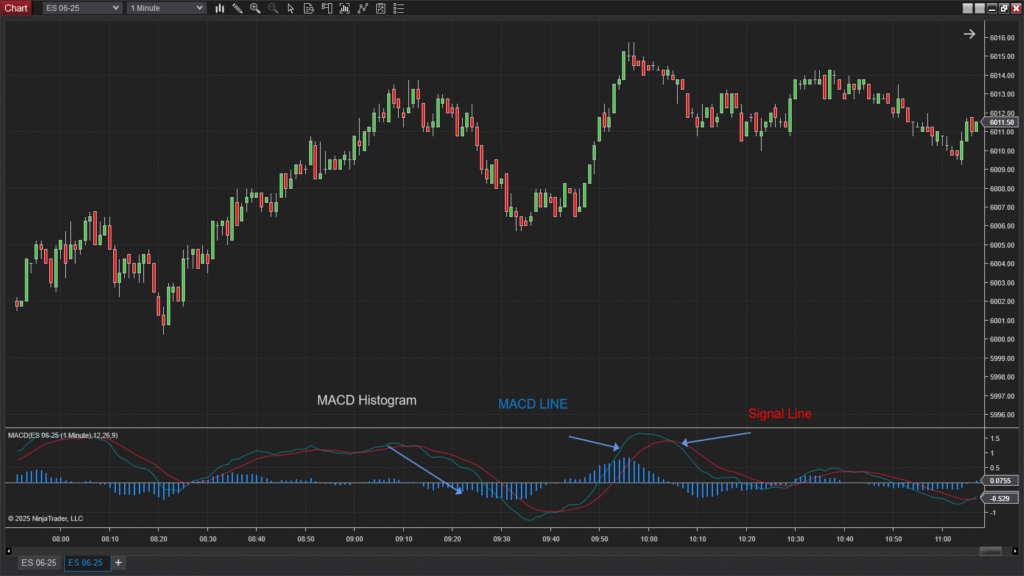
These three components provide powerful insight into market conditions:
- MACD Line shows momentum and direction.
- Signal Line is a smoothed version of the MACD line.
- Histogram visually highlights the difference between the two lines.
How to Read the MACD Indicator
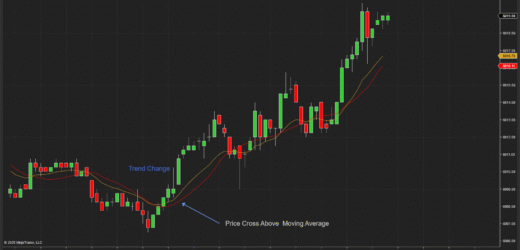
Crossover Signals
- Bullish Crossover: When the MACD Line crosses above the Signal Line, it may indicate a buy signal.
- Bearish Crossover: When the MACD Line crosses below the Signal Line, it could be a sell signal.
Zero Line Cross
- When the MACD Line crosses above zero, it suggests bullish momentum.
- When it crosses below zero, it indicates bearish momentum.
MACD Histogram
- Positive bars indicate increasing bullish momentum.
- Negative bars suggest growing bearish momentum.
- Shrinking bars may signal weakening momentum and a possible reversal.
MACD in Action: Example Strategy
One common approach is the MACD Crossover Strategy, which works like this:
- Buy Entry: When the MACD Line crosses above the Signal Line and both are below the zero line (indicating a fresh bullish signal).
- Sell Entry: When the MACD Line crosses below the Signal Line above the zero line (showing weakening bullish trend).
- Exit: When momentum reverses or the histogram starts to flatten.
This strategy works best in trending markets and should be confirmed with volume or price action analysis.
MACD vs RSI: What’s the Difference?
| Feature | MACD | RSI |
|---|---|---|
| Measures | Trend + Momentum | Overbought/Oversold |
| Best For | Trend confirmation | Timing entries/exits |
| Oscillation | Around 0 | Between 0–100 |
Using MACD + RSI together can provide more reliable signals by confirming both trend direction and market condition.
Pro Tips for MACD Trading
- Combine MACD with support/resistance levels or trendlines for higher accuracy.
- Avoid using MACD alone in sideways markets—it can give false signals.
- Pay attention to divergences: when price and MACD move in opposite directions, it can signal a reversal.
Common MACD Settings
| Timeframe | Fast EMA | Slow EMA | Signal Line |
|---|---|---|---|
| Default (Swing) | 12 | 26 | 9 |
| Fast Scalping | 6 | 19 | 3 |
| Long-Term | 19 | 39 | 9 |
The MACD indicator remains a cornerstone of technical analysis because of its versatility and accuracy in identifying momentum and trend shifts. When used correctly especially in conjunction with other tools MACD can help traders enter trades with greater confidence and exit at the right time.