

In the world of trading, many rely on candlestick patterns, moving averages, and lagging indicators to make decisions. But order flow trading takes a more precise and proactive approach by focusing on the actual orders being executed in real time. Instead of just watching price movements, it looks at the aggressiveness of buyers and sellers, their volume, and where liquidity is hidden. This provides a granular view of the market’s intentions revealing what truly drives price changes.
By observing how many contracts are being bought or sold at each price level and whether those orders are initiated by impatient buyers or sellers order flow traders can predict short-term market direction with greater confidence. It’s like upgrading from a weather forecast to a live radar system. You don’t just know where the storm might be you can see it forming.

What is Order Flow Trading?
Order flow trading is a methodology that focuses on analyzing the actual transaction data behind every price movement in the market. Instead of relying solely on historical price charts, order flow traders examine real-time data showing who is buying, who is selling, and in what volume. This includes market orders, limit orders, bid-ask imbalances, and more. By doing so, traders gain insight into market sentiment and the intentions of large participants, often before a price move fully develops.
Think of order flow as looking under the hood of the market. When you see a candle move up or down, you’re seeing the end result but not the why. Order flow reveals that reason. For example, if a market is rising but most of the trades are hitting the bid (meaning aggressive sellers are still dominant), that could indicate hidden weakness a potential trap or exhaustion setup. On the other hand, if buyers are attacking the ask with strong volume at a key level, it may show real commitment and likely continuation.
This edge makes order flow an invaluable tool for day traders, scalpers, and institutional professionals who need to make fast, data-driven decisions with confidence.
Understanding Market Orders vs Limit Orders
In order flow trading, distinguishing between market orders and limit orders is absolutely essential because they play very different roles in how price moves.
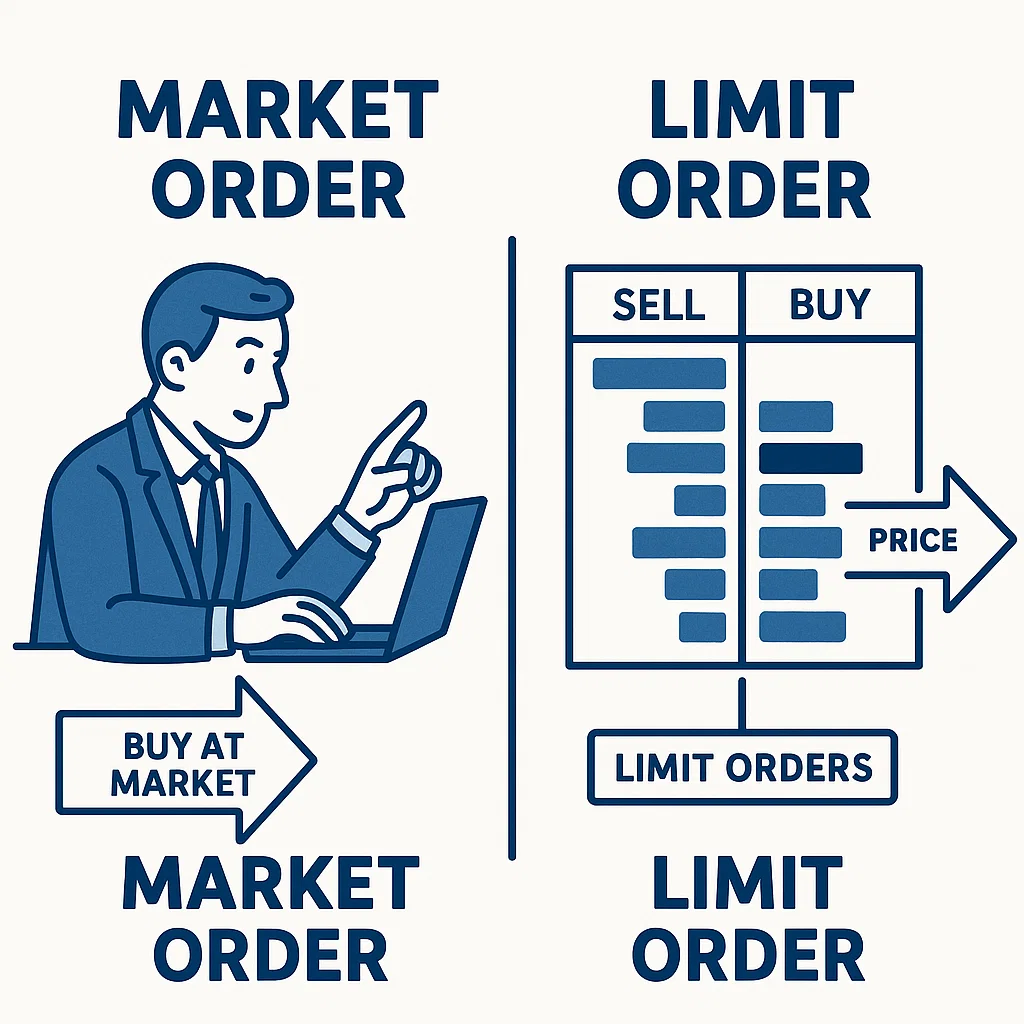
- A market order is an instruction to buy or sell immediately at the best available price. These are aggressive orders they cross the spread and remove liquidity from the market. When a trader hits the buy button at market, they’re willing to pay whatever the ask price is at that moment to get filled instantly. Similarly, market sells hit the bid price. Market orders are what cause price to move, because they consume existing limit orders on the opposite side.
- A limit order, on the other hand, is a passive order a trader places it at a specific price and waits for the market to come to them. These orders are what build the order book. For example, if you place a buy limit order at $100.50, you’re offering to buy at that price, but only if a seller agrees to your price. Limit orders provide liquidity and are visible in tools like the Depth of Market (DOM) or Level 2 screen.
Understanding the interaction between these two types of orders is at the heart of order flow analysis. When aggressive market buyers overwhelm the available sell limit orders, price moves up. Conversely, if large passive sellers (limit orders) absorb aggressive buying without price rising, that could signal absorption and potentially a reversal.
The Footprint Chart: Your Order Flow X-Ray
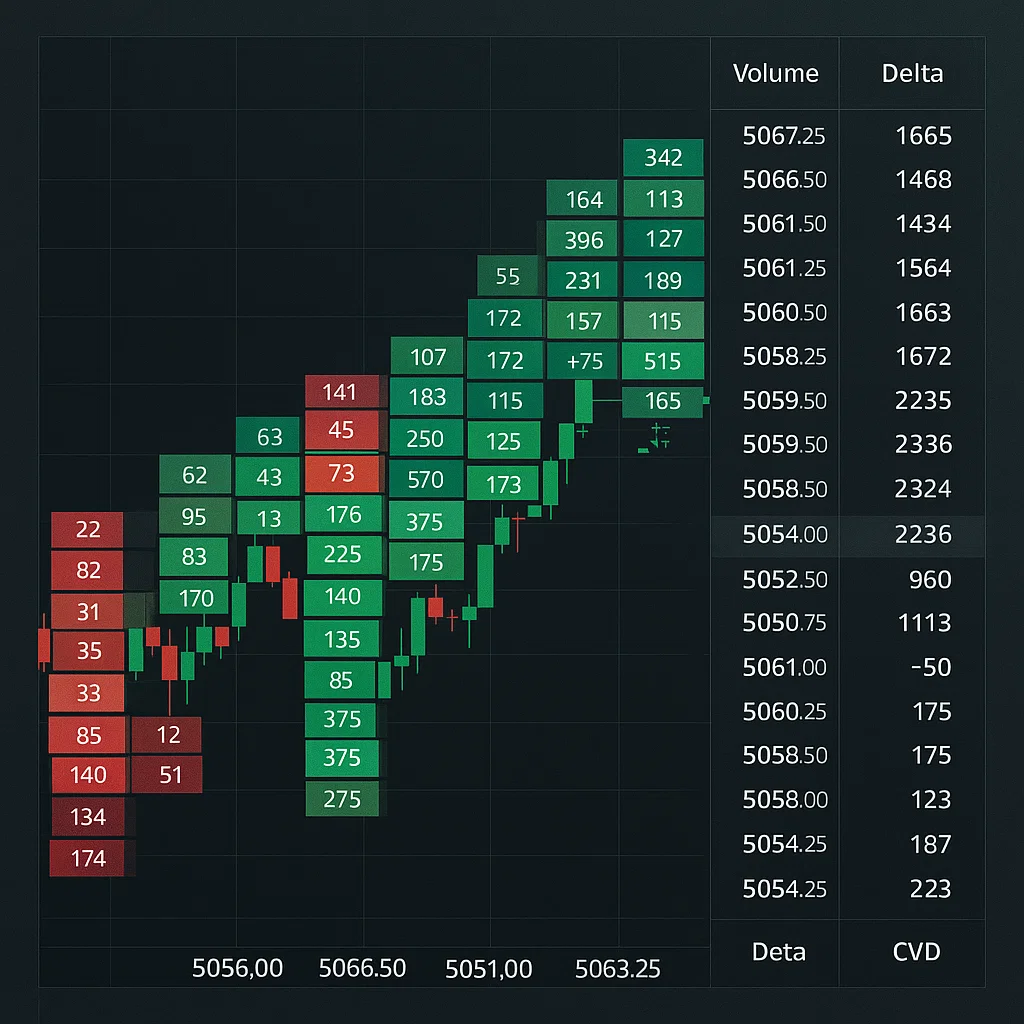
The footprint chart is one of the most powerful tools in an order flow trader’s arsenal. Think of it as an X-ray of each candlestick it reveals what’s really happening inside every price bar by showing exactly how much was bought or sold at each price level, and how those trades were executed (on the bid or ask).
Unlike traditional candlesticks that only show open, high, low, and close (OHLC), a footprint chart breaks down each candle into a matrix of data, such as:
- Volume at price – how many contracts traded at each price level.
- Bid x Ask volume – whether buyers were aggressive (lifting the ask) or sellers were dominant (hitting the bid).
- Delta – the net difference between aggressive buyers and sellers at each level.
- Imbalances – large differences between bid and ask that signal pressure or potential reversals.
Footprint charts help traders spot key order flow signals, like:
- Absorption (large limit orders stopping price from moving).
- Initiative buying/selling (strong aggression on one side).
- Exhaustion (diminishing trade volume before a reversal).
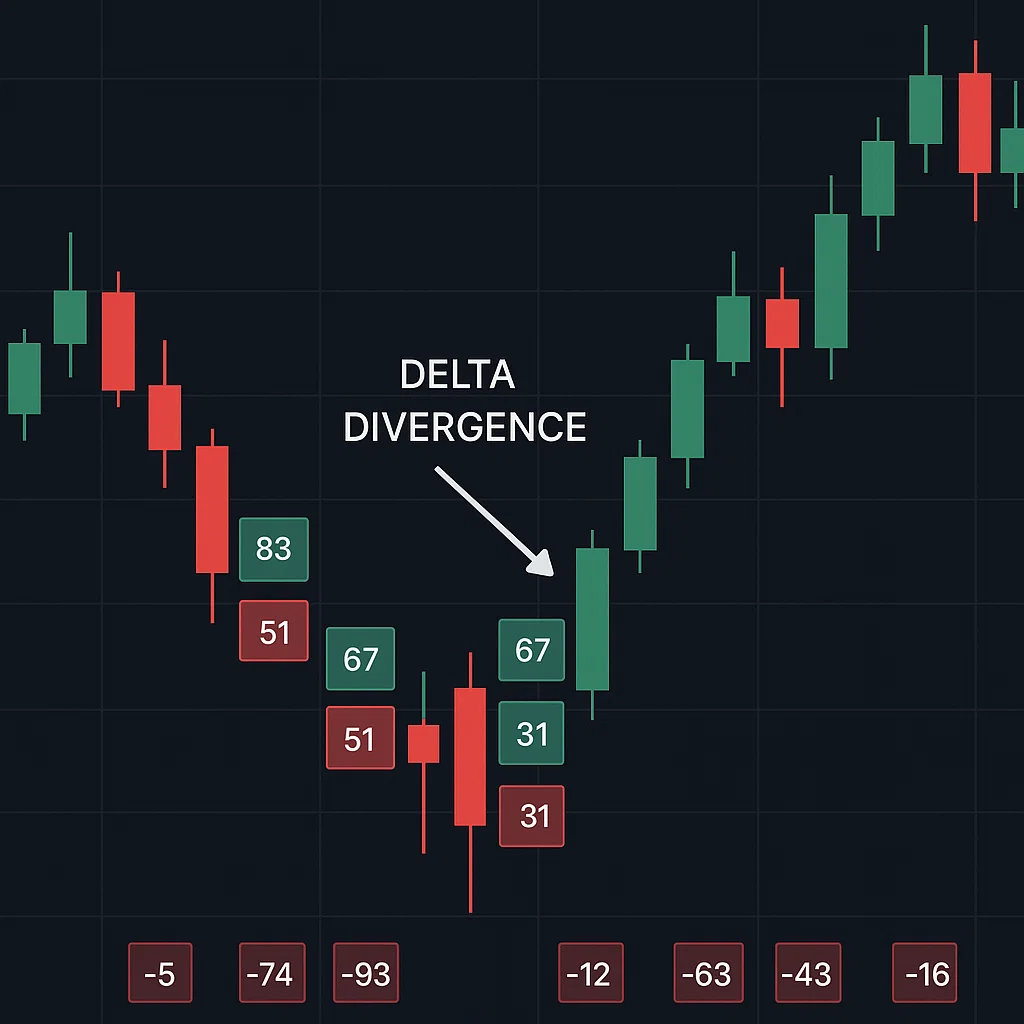
- Delta divergence (price moves in one direction, but order flow disagrees).
By reading these signs, traders can make smarter, faster decisions such as entering on pullbacks during strong buying, or exiting when they see signs of exhaustion or large iceberg orders.
What is Delta in Order Flow?
In the context of order flow trading, delta is one of the most important metrics you can analyze. Delta represents the net difference between aggressive market buyers and aggressive market sellers within a specific candle, bar, or price level.
Formulaically:
Delta = Market Buys (executed at the ask) − Market Sells (executed at the bid)
- A positive delta means more contracts were bought at the ask buyers were more aggressive.
- A negative delta means more contracts were sold at the bid sellers were in control.
Why is this important? Because delta shows who is taking the initiative in the market. If price is going up and delta is positive, the move is confirmed by aggressive buyers. But if price is rising while delta is negative, it can indicate a bearish divergence price may be rising on weak buying pressure, often a signal of a potential reversal.
Use Cases for Delta:
- Delta Divergence: When price rises but delta falls (or vice versa), it often indicates that the move is being driven by a lack of conviction. Smart traders watch for these conditions at key support/resistance areas.
- Stacked Delta: Consecutive candles showing consistent positive or negative delta can indicate trending momentum.
- Cumulative Delta: Adding delta over time helps traders visualize whether buyers or sellers are gradually winning the battle over a session or day.
By studying delta in combination with volume and price action, you can see beyond the candle and understand the true force driving each move allowing for more accurate entries, exits, and stop placements.
DOM (Depth of Market) and Order Book
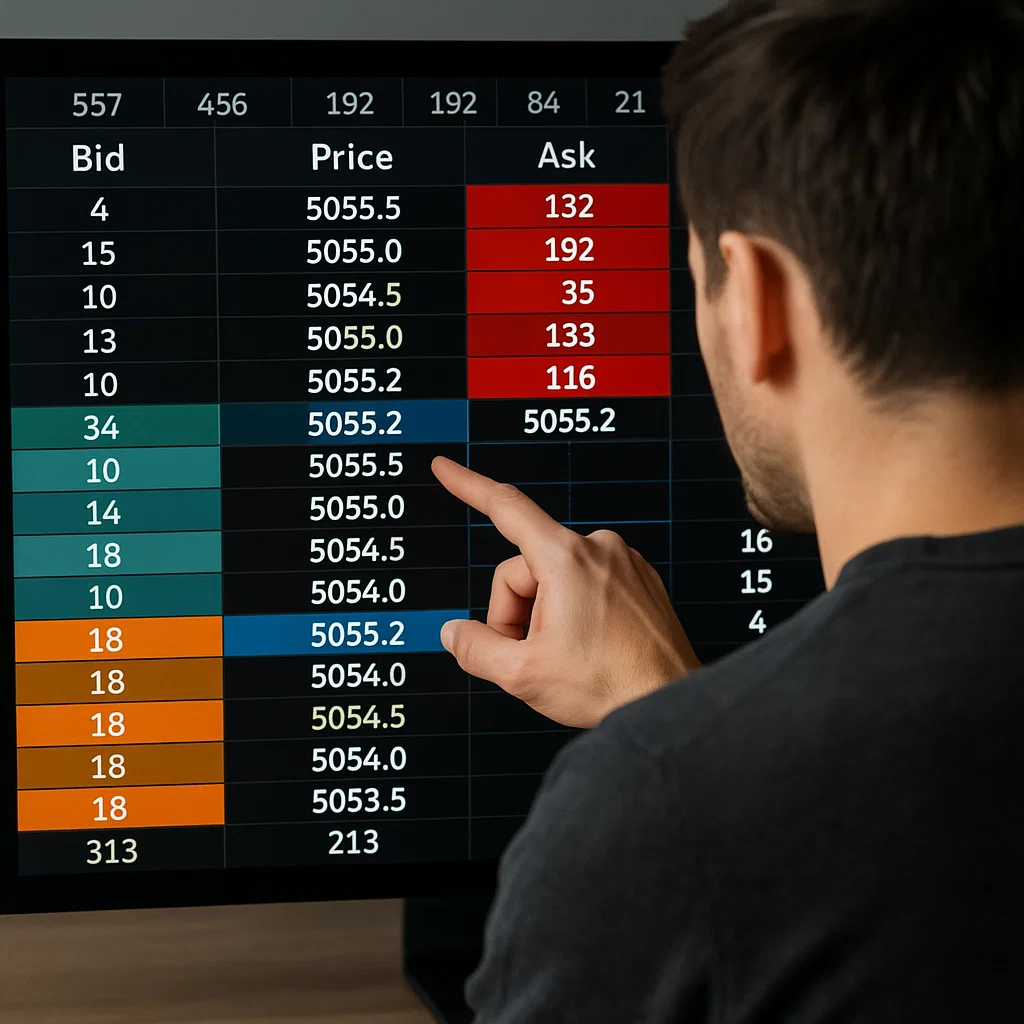
The Depth of Market (DOM) is a critical tool for order flow traders. It shows the buy and sell orders waiting to be filled at various price levels, providing a real-time snapshot of market liquidity. The DOM is displayed as a vertical ladder, with buy orders (bids) on the left and sell orders (asks) on the right. This gives you a clear view of the market’s order flow and helps you assess the strength of support and resistance levels in real-time.
Key Features of the DOM:
- Bid/Ask Levels: The DOM displays the quantity of contracts available at different price levels, which can help you gauge how much buying or selling pressure exists at those levels.
- Market Orders: When a market order hits the bid or ask, it removes liquidity from the DOM. The remaining orders adjust dynamically as more market participants engage.
- Order Book Visibility: The DOM provides visibility into the hidden supply and demand that can’t be seen on a standard price chart. Large orders that sit in the book often influence price, especially if they’re placed near key support or resistance zones.
What to Look for in the DOM:
- Liquidity Pools: Large blocks of orders at key levels act as potential support or resistance, depending on the direction of price. If you see a massive buy wall (lots of buy orders clustered at a specific price), the market may find it difficult to break below that price.
- Spoofing: Spoofing occurs when traders place large orders to trick others into thinking there is more liquidity than there actually is. These orders are often quickly canceled before being filled, and spotting spoofing behavior in the DOM can give you an edge in identifying false breakouts.
- Absorption: If price approaches a large order and stalls, it suggests that those large resting orders are absorbing all the buying or selling pressure without letting price move significantly. This can often signal a reversal or a pause in the current trend.
The DOM isn’t just a tool for observing price it helps traders gauge the market’s mood, uncover liquidity imbalances, and react quickly when the market reveals its intentions.
Absorption and Rejection
Absorption and rejection are two key concepts in order flow trading that provide invaluable insights into market behavior and potential price reversals. Understanding these can help traders anticipate key turning points before they happen, making them indispensable in a trader’s toolkit.
Absorption
Absorption occurs when large resting limit orders are able to absorb a significant amount of aggressive market orders without allowing price to move significantly. Essentially, these large limit orders act as a barrier, soaking up buy or sell pressure.
- When price approaches a key level and does not move despite significant buying or selling activity, this is called absorption. It suggests that there are large participants (like institutional traders or market makers) willing to defend or support that level by providing liquidity.
- Absorption signals strength: If large sellers are unable to push price lower or buyers are unable to push it higher, the market is likely absorbing the pressure creating the potential for consolidation or a reversal.
For example, if price is moving down and it encounters a large buy wall in the DOM that absorbs the selling pressure, this could signal a bullish reversal or a temporary pause in the downtrend. In contrast, a sell wall that absorbs buying could lead to a bearish turn.
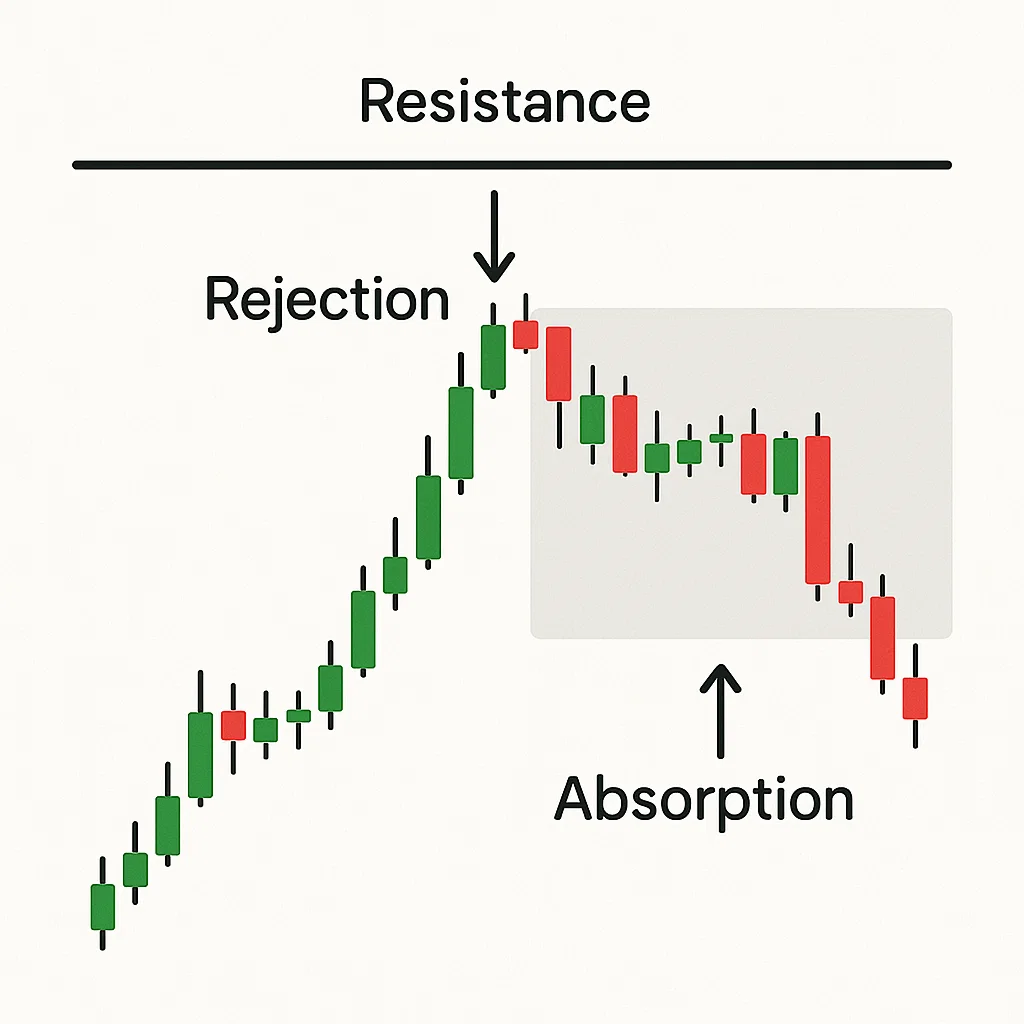
Rejection
Rejection is the opposite when price fails to break through a significant level and quickly bounces away. This often occurs when price reaches a level where there’s a lack of interest beyond that price point, leading to a sharp reversal. Rejection typically signals weakness in the market sentiment and suggests that price will likely reverse or stall in the direction of the rejection.
- A classic example of rejection is when price reaches a resistance level and is pushed back by aggressive selling (market orders hitting the bid). The rejection is often seen as a sign of market exhaustion, and it could indicate that price is unlikely to move higher, at least in the short term.
How to Spot Absorption and Rejection in Order Flow:
- Absorption: Watch for thick clusters of limit orders at key price levels. If price approaches these levels and moves sideways or stalls, it could indicate absorption is happening.
- Rejection: Rejection typically occurs when price moves quickly away from a level with low volume or after a failure to break through a significant price point. Watch for sharp reversals or candles with long wicks, especially in conjunction with volume spikes.
Both absorption and rejection are powerful signals in order flow trading because they indicate where the market is struggling to move in a specific direction, which often precedes major turning points.
Order Flow Trading Strategy Example
To put everything we’ve covered into practice, let’s walk through a real-world order flow trading strategy that combines key concepts like delta, absorption, and rejection. This strategy can be used by day traders or scalpers to catch high-probability, short-term price moves.
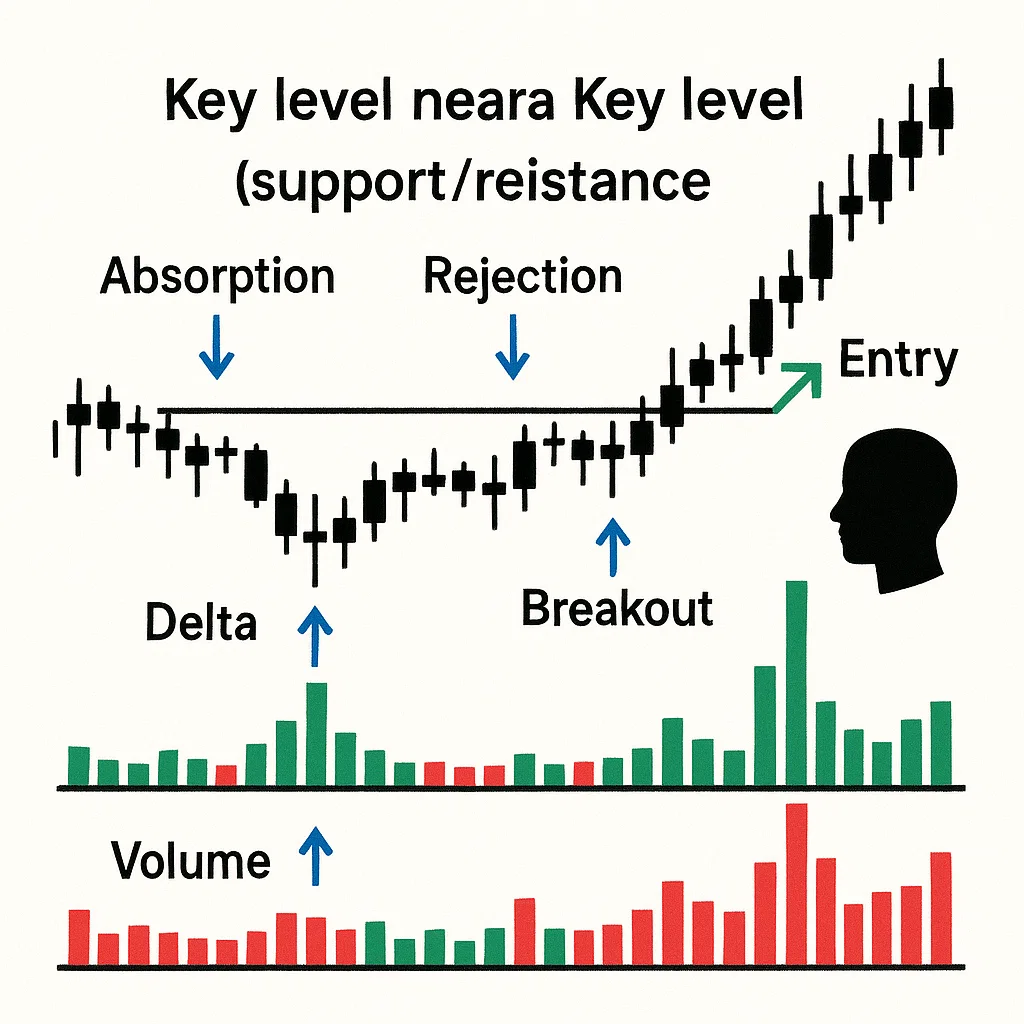
Step 1: Identify Key Levels
The first step in any order flow strategy is to identify significant price levels these are areas of interest where price has previously reversed, paused, or consolidated. These could be:
- Support and resistance zones.
- Recent highs and lows.
- Round numbers (e.g., 1.2000, 50.00) where traders might expect psychological reactions.
These levels act as pivot points where price is more likely to either bounce or break. Pay attention to how the market behaves around these levels, as they can be key to setting up your trade.
Step 2: Observe Delta Behavior
Once you’ve identified your key level, the next step is to observe the delta behavior at that level. The interaction between buyers and sellers in the order flow will give you the first clue about what the market intends to do.
- Positive delta at support: If price approaches a support level and you see aggressive buying (positive delta) with strong volume, the market may be poised to bounce higher. This suggests that buyers are stepping in with conviction, likely absorbing any selling pressure.
- Negative delta at resistance: Conversely, if price approaches a resistance level and aggressive selling (negative delta) is visible, it could indicate a downward rejection. Sellers are in control, and price may reverse downward from this level.
Step 3: Look for Absorption or Rejection
At your key levels, watch for absorption or rejection signs. This step will confirm whether the market is truly ready to move or if it’s struggling.
- Absorption at support: If large buy orders are soaking up the sell pressure at support, you may witness price stalling or consolidating before pushing higher. This suggests strong buy interest is building, setting up a potential long trade.
- Rejection at resistance: If price reaches a resistance level and quickly rejects moving back down with a large negative delta it signals weakness in buying and suggests a short position might be the way to go.
Step 4: Confirm with Volume and Market Orders
Once absorption or rejection has been identified, volume and market orders are your confirmation tools. Look for signs that market participants are either stepping in or pulling out.
- High volume at breakout levels: If price breaks a key level with high volume, it’s a good signal that the market is trending in that direction. This is especially powerful when combined with strong delta and visible order flow behavior.
- Volume decreasing during retracement: If price retraces after breaking through a key level but volume drops off, it could indicate a lack of follow-through a potential sign of reversal.
Step 5: Execute Your Trade
With all the data at your fingertips, it’s time to execute your trade. You can enter the market with:
- A market order if you’re confident in the immediate momentum (for example, if you see strong buying and positive delta at support).
- A limit order if you’re waiting for a pullback to a key level, allowing you to enter at a more favorable price (for instance, when absorption at a level shows signs of continuation).
Example Trade:
- Market: S&P 500 E-mini futures.
- Key Level: 4,100 (a strong support area based on previous price action).
- Delta Behavior: At 4,100, you see strong positive delta with buyers lifting the ask. Volume spikes, confirming the buying interest.
- Absorption: A large buy wall is present at 4,100, and the price stalls as this liquidity absorbs selling pressure.
- Trade Execution: You place a long order at 4,101 after confirmation that the market is absorbing sell orders. Your target is 4,115, with a stop just below 4,100 to minimize risk.
This is just one example of how order flow trading can help you enter high-probability trades with confidence, using real-time data to guide your decisions.
Advanced Tips for Order Flow Trading
Once you’ve grasped the basics of reading order flow footprint charts, delta, DOM, absorption, and rejection you can take your trading to the next level with more refined techniques and mindset adjustments. Mastering order flow requires constant refinement, practice, and awareness of the subtle behavior of markets and participants.
1. Use Cumulative Delta for Context
While regular delta shows moment-by-moment pressure, cumulative delta tracks the net buying or selling pressure over time. It helps you see whether buyers or sellers are gradually gaining control throughout a session.
- If price is rising but cumulative delta is falling, that’s a bearish divergence, suggesting that the rally is weak and might reverse.
- If price is dropping while cumulative delta is climbing, that’s a bullish divergence, possibly signaling buyer absorption and a coming reversal.
This is especially powerful when aligned with volume and price action patterns.
2. Watch for Delta Traps
A delta trap occurs when the delta shows heavy aggression from one side (e.g., strong buying), but price fails to follow through. This can trap late buyers, and often leads to a sharp reversal as they scramble to exit.
- If you see a candle with high positive delta but the next candle closes lower, that’s a sign buyers were trapped.
- These traps often mark tops or bottoms, especially at significant levels.
They’re also excellent setups for countertrend trades with tight risk.
3. Use Imbalances to Find Pressure Zones
Footprint charts often highlight bid/ask imbalances, where there’s a significant difference (e.g., 400%) between buyers and sellers at a price level.
- Stacked buy imbalances across multiple levels can indicate strong buying pressure and a potential bullish continuation.
- Stacked sell imbalances suggest aggressive selling and potential bearish breakdown.
These areas can act as momentum zones or support/resistance, depending on context.
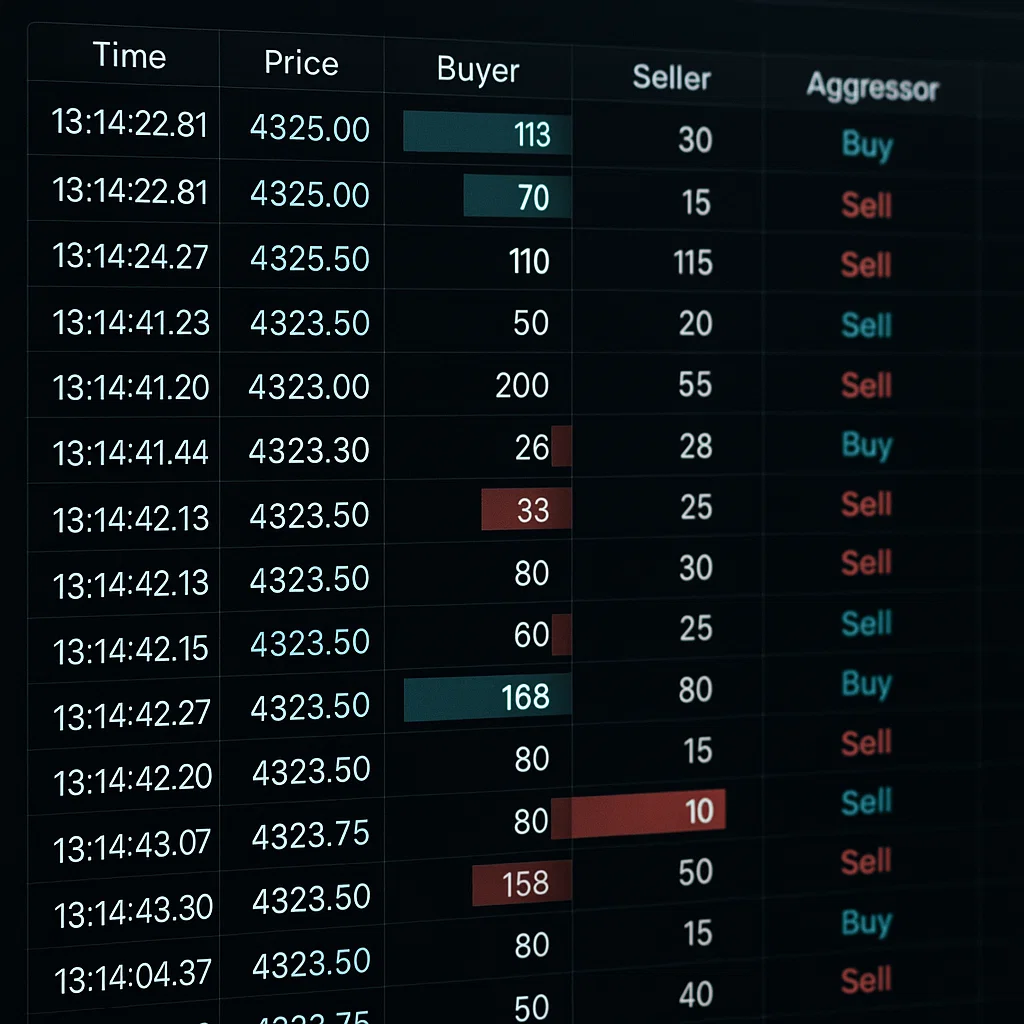
4. Pay Attention to Time & Sales (Tape Reading)
For advanced traders, watching the tape the stream of real-time trade prints can add an edge. Look for:
- Unusually large market orders (iceberg orders revealing smart money activity).
- Burst of small orders during a breakout (FOMO-driven retail chase).
- Speed and rhythm of orders fast tape often signals emotional markets and breakouts.
Tape reading is subjective and skill-based, but when mastered, it helps you anticipate liquidity shifts and fake-outs in real time.
5. Focus on Risk and Trade Location
Order flow gives you an edge in timing, but risk management is still king. Your job isn’t just to read the tape it’s to find low-risk trade locations where:
- The risk is clearly defined (e.g., just below a large buy wall).
- Reward-to-risk is favorable (e.g., 3:1 or higher).
- You’re not chasing price you’re reacting to objective signals.
Successful order flow traders wait for the market to come to them, not the other way around.
6. Record and Review Your Sessions
Order flow analysis can feel overwhelming at first. The best way to learn is to:
- Record your screen while trading.
- Annotate your trades why you entered, where delta shifted, what the DOM looked like.
- Review good and bad trades with screenshots of footprint charts and DOM.
This builds pattern recognition, helping you refine your entries and improve consistency.

Conclusion: Turning Market Noise into Insight
Order flow trading turns what most traders see as random market noise into actionable insights. By reading the behavior of real buyers and sellers, you can:
- Enter with confidence.
- Exit before the crowd.
- Avoid false breakouts.
- Identify where the market is truly strong or weak.
It’s not about predicting the future it’s about reacting to what the market is telling you right now, in real time. With the right tools, mindset, and risk management, order flow trading can give you an edge that few retail traders possess.