
What is the ADX (Average Directional Index) Indicator?
The ADX (Average Directional Index) indicator is a powerful tool used in technical analysis to quantify the strength of a market trend. Developed by the legendary analyst Welles Wilder, it’s part of a broader family of indicators designed to help traders understand whether a market is trending and how strong that trend is.
While most indicators try to tell you which direction the market is going, ADX focuses purely on trend strength not direction. This makes it incredibly useful whether you’re a bullish buyer or a bearish seller. By eliminating the noise of market direction and focusing solely on strength, it gives traders a unique edge.
History and Development of the ADX Indicator
Welles Wilder introduced the ADX in his groundbreaking 1978 book, New Concepts in Technical Trading Systems. He also created other popular tools like the RSI and ATR. Originally designed for commodity trading, the ADX has since found universal application across stocks, forex, crypto, and indices.
Wilder’s goal was to build an objective way to assess whether a market was trending strongly enough to justify a trade a problem that many traders still face today. His solution? The ADX and its accompanying lines: +DI and -DI.
Core Components of the ADX
To understand the ADX fully, you need to break it into three parts:
The ADX Line
This is the central piece. It tells you how strong a trend is—regardless of whether it’s up or down. A rising ADX line means increasing trend strength. A falling ADX suggests weakening momentum.
The +DI and -DI Lines
These represent Directional Movement Indicators:
- +DI (Positive Directional Indicator): Shows strength of upward movement.
- -DI (Negative Directional Indicator): Reflects strength of downward movement.
When +DI is above -DI, bulls are in control. When -DI is above +DI, bears dominate.
How the ADX Indicator Works
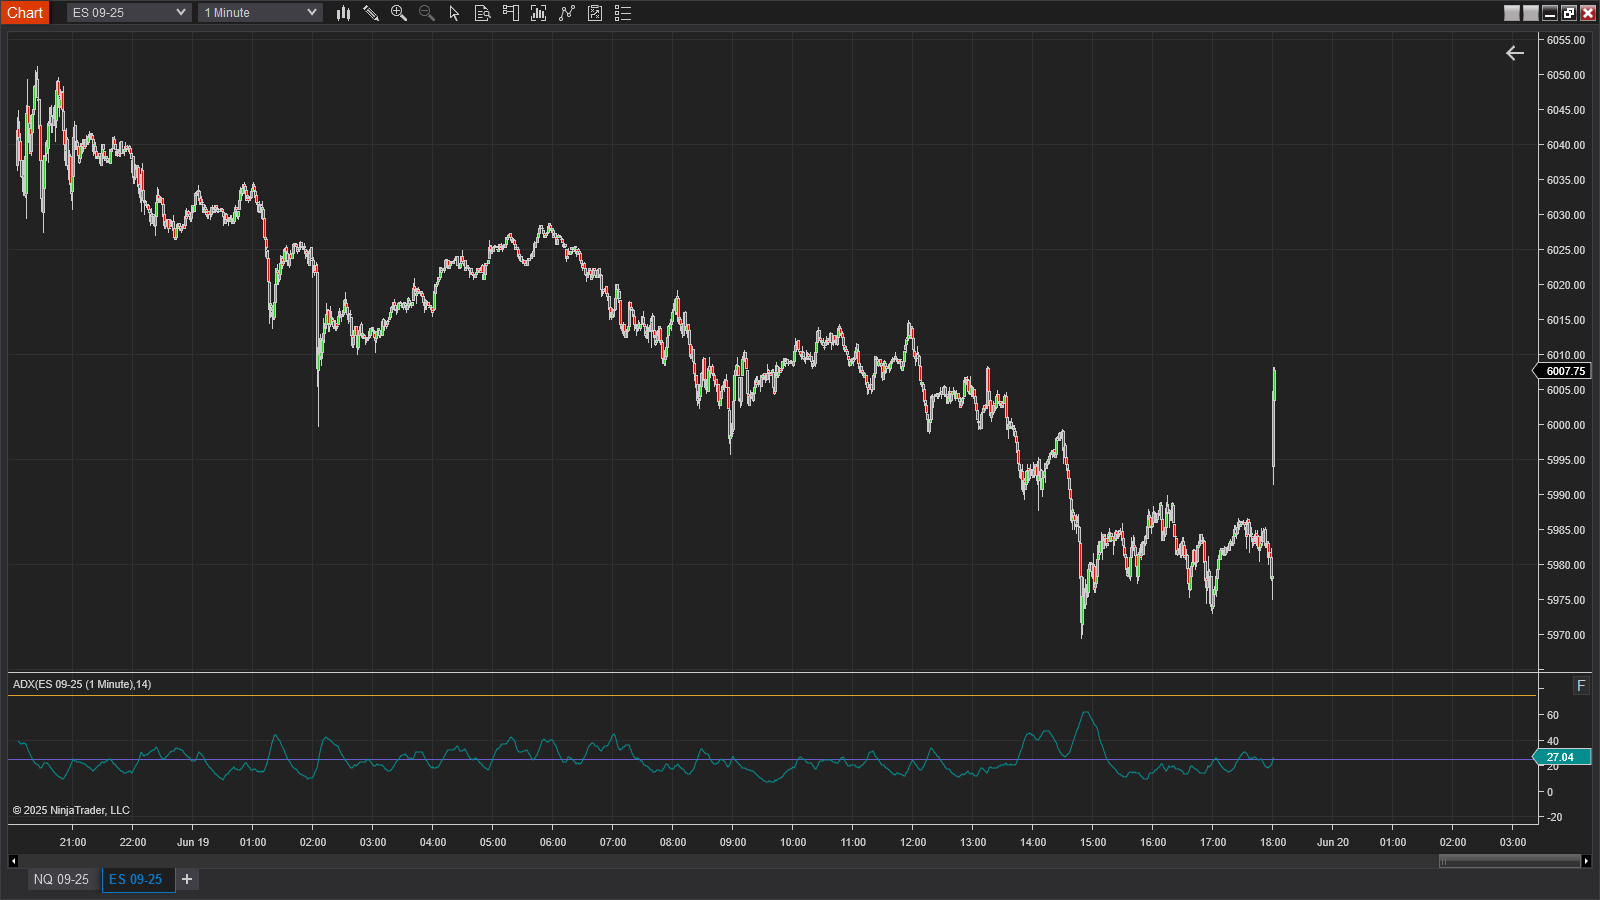
The ADX is calculated using a moving average of the difference between +DI and -DI over a set period (commonly 14 bars). It does not show trend direction—only strength.
Here’s how it typically works:
- Calculate +DM and -DM (Directional Movement)
- Smooth out these values with a moving average.
- Divide the smoothed +DM and -DM by the True Range.
- The result forms the +DI and -DI values.
- ADX is then calculated as a smoothed average of the absolute value of the difference between +DI and -DI.
This might sound complex, but most modern platforms calculate it automatically.
Interpreting ADX Readings
Understanding what the ADX number tells you is key:
| ADX Value | Meaning |
|---|---|
| 0–20 | Weak trend or ranging market |
| 20–40 | Emerging or moderate trend |
| 40–60 | Strong trend |
| 60+ | Very strong or extreme trend |
These thresholds help traders decide whether to stay in a trade or avoid false signals.
ADX Indicator in Trend Trading
In trend-following strategies, the ADX can be a game-changer. Here’s how traders use it:
- When ADX rises above 20 or 25, it often signals a trend is forming.
- Combined with crossovers between +DI and -DI, it can confirm trade direction.
- ADX above 40? That’s a sign to ride the trend.
- ADX falling below 20? Time to stay out or trade the range.
It’s especially powerful when used to filter out fake breakouts—a common headache for traders.
Combining ADX with Other Indicators
ADX is rarely used in isolation. To maximize its potential, traders often pair it with:
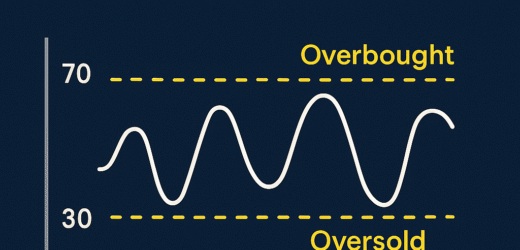
- RSI (Relative Strength Index): Confirms overbought/oversold conditions.
- MACD (Moving Average Convergence Divergence): Identifies momentum shifts.
- Moving Averages: Define overall trend direction.
This combo helps you avoid false signals and confirm entries/exits.
Best Settings for the ADX Indicator
The default setting is 14 periods, but this can be adjusted:
- Short-term trades: Use 7-10 periods for faster signals.
- Long-term or swing trades: Stick with 20-30 periods for stability.
Test what works best based on your asset and trading strategy.
Pros and Cons of the ADX Indicator
| Pros | Cons |
|---|---|
| Works in any market | Does not indicate trend direction |
| Helps avoid fake signals | Can lag in fast markets |
| Excellent for trend confirmation | Needs combo with other tools |
Real-Life Trading Examples Using ADX
magine trading a stock that’s broken a key resistance level. You notice:
- ADX rising above 25
- +DI crossing above -DI
- RSI confirming strength
This is a strong buy signal using ADX as the anchor. You ride the trend, and when ADX starts to fall, it’s your cue to exit gracefully.
Common Mistakes to Avoid with ADX
- Using ADX alone: Always combine with directional or momentum tools.
- Chasing extreme ADX values: High ADX doesn’t mean trend will continue forever.
- Ignoring price action: ADX should support—not replace—your chart analysis.
Advanced Strategies Using ADX
- Breakout Confirmation: Wait for ADX > 25 before entering breakout trades.
- Reversal Watch: A falling ADX while price continues trending may warn of reversal.
- Divergence Play: Look for price moving up but ADX falling—momentum could be fading.
These advanced setups can offer great risk-reward ratios.
ADX for Day Trading vs. Swing Trading
- Day Traders: Use tighter settings, lower timeframes, quick crossovers.
- Swing Traders: Rely on daily charts, longer settings for stable trends.
Each trading style benefits from different tweaks—know your goals.
Tools and Platforms that Support ADX
You can access the ADX indicator on:
- TradingView
- MetaTrader 4 & 5
- Thinkorswim
- NinjaTrader
- Most crypto and stock platforms
These platforms allow custom settings and overlays for better visualization.
FAQs About ADX (Average Directional Index) Indicator
Q1. Is ADX good for beginners?
Yes, once understood properly. It simplifies trend strength analysis.
Q2. What does ADX 25 mean?
It typically signals the start of a strong trend.
Q3. Can I use ADX for scalping?
Scalpers prefer faster indicators, but a fast-period ADX can be useful with proper testing.
Q4. Does ADX repaint or lag?
ADX is a lagging indicator—it confirms trends, it doesn’t predict them.
Q5. What’s better—ADX or RSI?
Both serve different purposes: ADX = trend strength, RSI = momentum/extremes.
Q6. How can I use ADX with candlestick patterns?
Use candlestick breakouts alongside rising ADX to confirm strong entry setups.
Is the ADX Indicator Right for You?
The ADX (Average Directional Index) indicator is a staple in the toolkit of trend traders. Whether you’re analyzing forex, crypto, or stocks, understanding trend strength is crucial—and that’s exactly what ADX excels at. While it’s not perfect, pairing it with other indicators and strategies can dramatically improve your trade timing and reduce guesswork.