
Most traders never realize that the biggest mistake they make happens long before they enter a trade.
It happens before the indicator is added to the chart. Before the stop loss is placed. Before the strategy is chosen. In fact, it often happens during the very first days of their trading journey when they unknowingly begin studying the wrong thing.
Like most traders, I started by studying price. Every book, every video, every course seemed to focus on the same objective: predicting where the market would go next. The entire industry appeared obsessed with entries, exits, indicators, and setups. Success seemed to belong to whoever could predict the next move with the highest degree of accuracy.
At first, this approach made perfect sense. After all, if trading is about making money from price movement, then studying price should be enough.
The problem is that after years of watching charts, I began noticing something strange.
Many traders could identify the same patterns, use the same indicators, and follow the same strategies, yet their results were completely different. Some consistently made money while others continuously lost. If everyone had access to the same charts, then clearly the difference wasn’t the chart itself.
The difference was how they understood what was happening behind the chart.
That realization changed everything.
I eventually discovered that most successful traders weren’t spending their time trying to predict price. Instead, they were trying to understand the auction taking place underneath it.
This may sound like a small distinction, but it completely transformed the way I viewed financial markets.
The market is not a chart.
The market is not a collection of candlesticks.
The market is not an indicator.
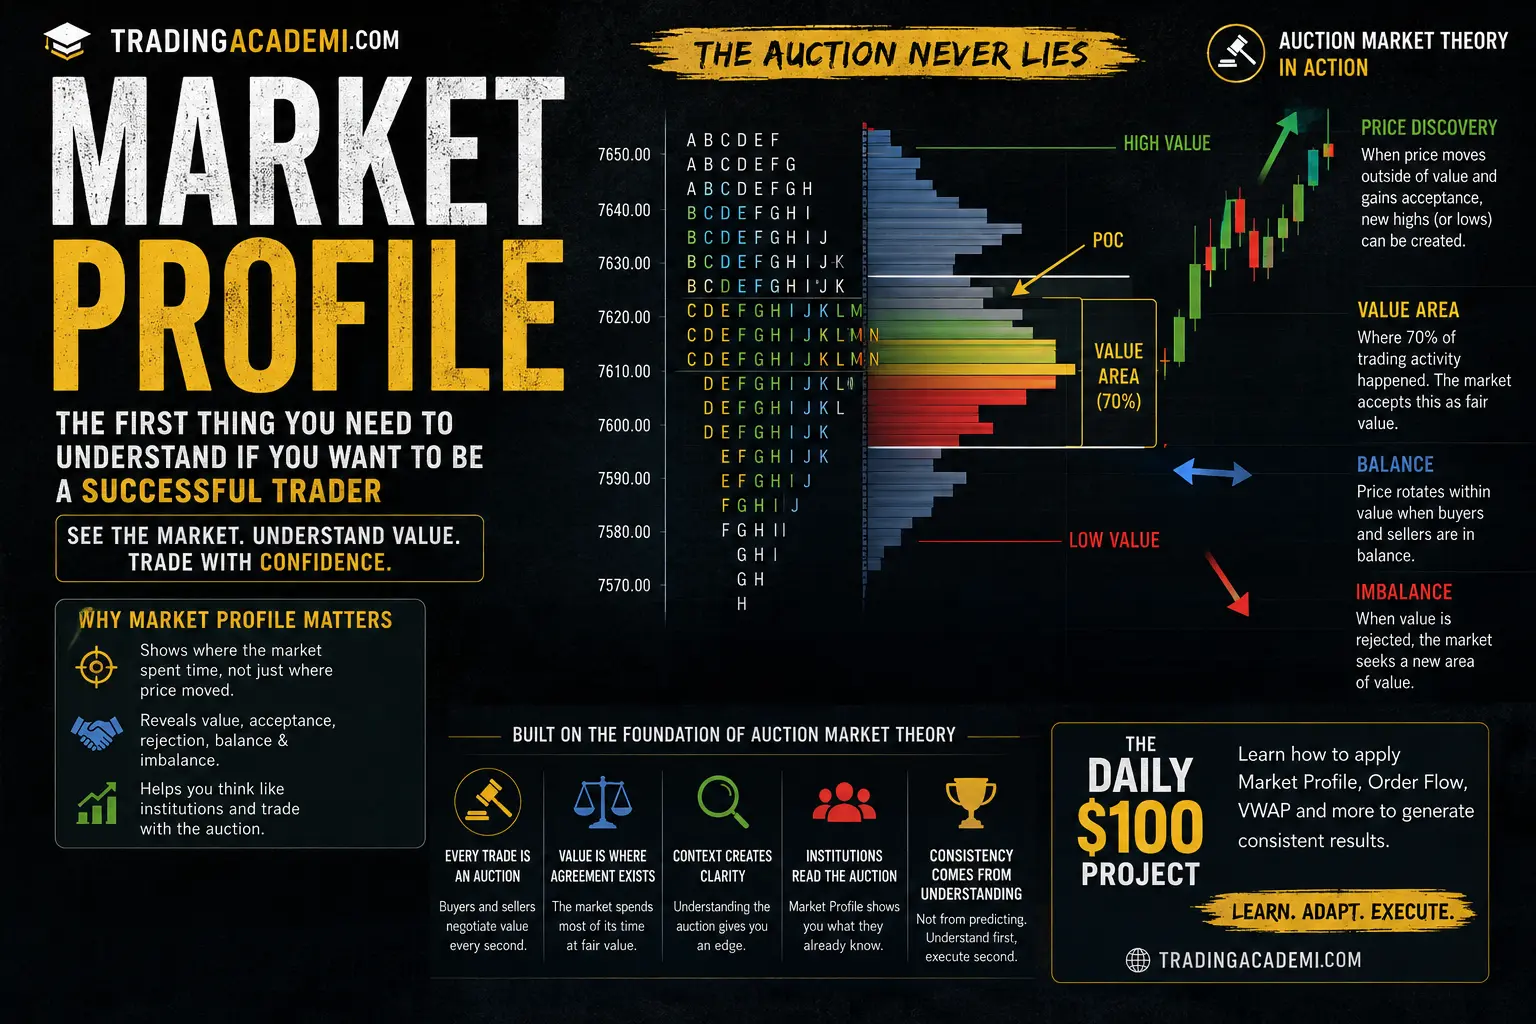
The market is an auction.
Every second of every trading session, buyers and sellers negotiate value. One participant believes a price is attractive enough to buy while another believes that same price is attractive enough to sell. Every transaction that takes place is simply the result of this disagreement.
Price is merely the visible result of a much deeper process.
Unfortunately, most traders spend years studying the result while completely ignoring the process.
This is where Market Profile enters the conversation.
Market Profile is one of the few concepts in trading that has the ability to completely change the way a person sees the market. It doesn’t provide magical entries. It doesn’t promise 90% win rates. It doesn’t offer a shortcut to profitability.
What it does offer is something far more valuable.
It offers understanding.
The first time I truly understood Market Profile, it felt as though someone had removed a blindfold that I didn’t even know I was wearing. For years I had been watching candles move up and down, believing I was studying the market. In reality, I was only observing the surface.
Market Profile allowed me to see what was happening underneath.
Instead of focusing solely on price, I began focusing on value.
Instead of asking where price was going, I started asking where the market believed fair value existed.
Instead of chasing breakouts, I started studying acceptance and rejection.
The more I studied these concepts, the more I realized that many of the market’s seemingly random movements were not random at all.
They were simply part of the auction process.
This discovery eventually became one of the foundations behind The Daily $100 Project.
When I began creating The Daily $100 Project, I had no interest in building another trading course that simply told people where to buy and where to sell. The internet already contains thousands of those. Every day new traders are taught to memorize setups without ever understanding the logic that creates those setups in the first place.
The goal of the project was different.
I wanted traders to understand why markets move.
I wanted them to understand why trends develop, why breakouts fail, why support and resistance work, why some sessions trend all day while others rotate endlessly.
Most importantly, I wanted traders to understand the auction.
Because once you understand the auction, every tool becomes easier to understand.
VWAP becomes easier to understand.
Volume Profile becomes easier to understand.
Footprint Charts become easier to understand.
Order Flow becomes easier to understand.
Even simple candlesticks begin telling a completely different story.
This is why Market Profile sits so close to the beginning of the educational roadmap.
Not because it is easy.
Not because it is popular.
But because it teaches traders how to think differently.
And successful trading is often less about finding better setups and more about developing a better framework for understanding the market itself.
One of the biggest misconceptions among retail traders is the belief that price and value are the same thing.
They are not.
Price is simply the number currently displayed on the chart.
Value is the market’s perception of fairness.
That distinction explains a tremendous amount of market behavior.
Think about a shopping mall.
Imagine a store selling a television for $100. The moment people see that price, demand explodes. Customers rush into the store because they believe the television is worth far more than $100.
Now imagine the same television being sold for $10,000.
Demand disappears almost instantly.
The product is identical.
The difference is value.
Financial markets work exactly the same way.
Every day, participants are constantly determining whether current prices represent value or not. When buyers and sellers generally agree on value, the market becomes balanced. Price rotates within a relatively stable area because there is no strong reason for it to move elsewhere.
When that agreement disappears, the market begins searching.
This search for value is what creates trends.
This search for value is what creates breakouts.
This search for value is what creates volatility.
Most traders only see the movement.
Market Profile helps us understand the reason behind the movement.
This is one of the reasons professional traders often think very differently from retail traders.
Retail traders frequently ask questions such as:
“Should I buy here?”
“Should I sell here?”
“Is this breakout real?”
Professional traders often ask something completely different.
They ask whether the market is accepting higher prices.
They ask whether value is migrating.
They ask whether the auction is balanced or imbalanced.
They ask whether participants are facilitating trade or rejecting it.
These questions may seem subtle, but they reveal an entirely different perspective on the market.
And this perspective becomes increasingly important as traders begin exploring more advanced tools such as Order Flow and Footprint Charts.
Many traders discover Order Flow before they understand the auction.
They become fascinated by delta, absorption, imbalances, trapped traders, and aggressive buyers and sellers. These concepts are powerful, but without context they often become confusing.
A footprint signal means very little if you do not understand where it is occurring.
Aggressive buying at value is different from aggressive buying after a failed auction.
Absorption inside balance is different from absorption at the edge of value.
A delta divergence means something entirely different depending on where it occurs within the auction.
Market Profile provides that missing context.
It tells us where we are.
Order Flow tells us what participants are doing at that location.
Together they create a framework that is infinitely more powerful than either tool alone.
This relationship between context and execution is one of the central themes discussed throughout The Daily $100 Project. The project was never designed to create traders who blindly copy signals. It was designed to help traders understand the environment in which those signals appear.
Because context always comes before execution.
The longer I spend in the markets, the more convinced I become that consistency is not the result of finding a perfect setup.
Consistency comes from understanding context.
The same setup can be profitable in one location and disastrous in another.
The same breakout can lead to a trend day or a complete failure.
The same VWAP reaction can produce continuation or reversal.
The difference is rarely the setup itself.
The difference is usually the auction surrounding the setup.
This is why I often tell traders that learning Market Profile is one of the most important investments they can make in their trading education.
Not because it guarantees profits.
Not because it predicts the future.
But because it teaches them how markets actually function.
Once you begin seeing the market through the lens of value, acceptance, rejection, balance, and price discovery, it becomes very difficult to go back to viewing trading as a collection of random candles.
You begin seeing structure where others see chaos.
You begin seeing logic where others see randomness.
And perhaps most importantly, you begin understanding that successful trading is not about predicting every move.
It is about understanding the auction well enough to participate when opportunity presents itself.
That understanding is where real trading begins.
How We Actually Use Market Profile in Real Trading
At this point, a natural question appears.
If Market Profile helps us understand value, how do we actually use that information during a live trading session?
This is where many traders make another mistake. They believe Market Profile is designed to predict the future. It is not.
Market Profile is designed to tell us what the market is doing right now.
Every morning, before thinking about entries, targets, or even trade direction, the first thing we want to understand is where the market currently considers value.
The reason is simple.
Professional traders are not interested in random price movement. They want to understand where buyers and sellers are doing business. They want to identify the areas where agreement exists and where disagreement begins.
When we analyze a Market Profile chart, one of the first things we look for is the Value Area and the Point of Control (POC).
These levels provide a snapshot of where the majority of business was conducted during the previous session. In other words, they show us where the market believed fair value existed.
The next step is observing how the current session reacts around these levels.
If the market opens inside value and remains accepted inside value, we know that buyers and sellers are generally still agreeing on price. This often creates rotational behavior where price moves back and forth around value.
However, when the market opens outside value and successfully gains acceptance outside that area, something much more interesting begins to happen.
The market starts searching for a new area of value.
This is where trends often begin.
This is where price discovery starts.
And this is where some of the best opportunities can appear.
The objective is not to predict these movements before they happen. The objective is to recognize them while they are developing.
That is a very important distinction.
Many traders want certainty.
Professional traders want information.
Market Profile provides that information.
It allows us to identify who is currently in control of the auction.
Are buyers accepting higher prices?
Are sellers successfully rejecting value?
Is the market balanced?
Or is it entering a new phase of imbalance and price discovery?
These questions form the foundation of our daily analysis.
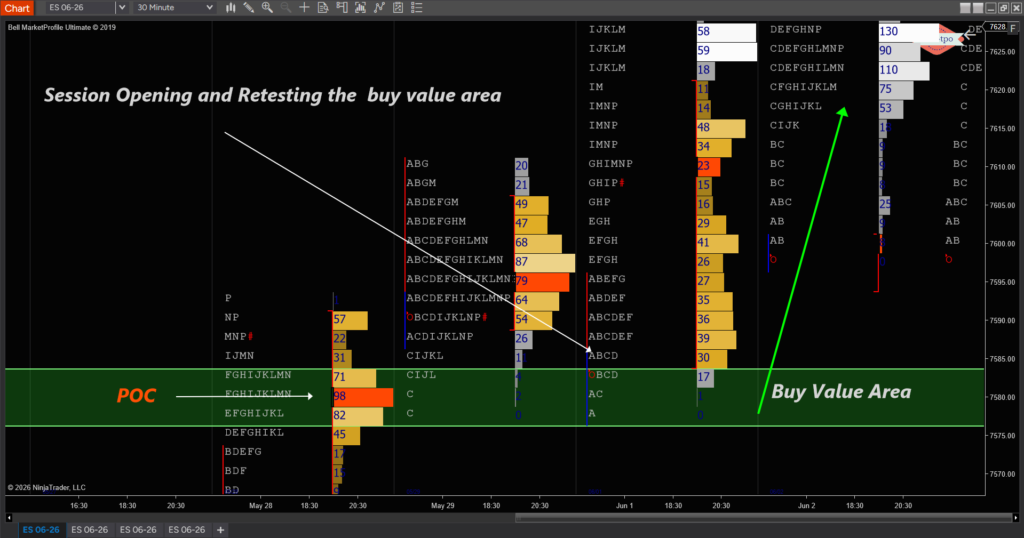
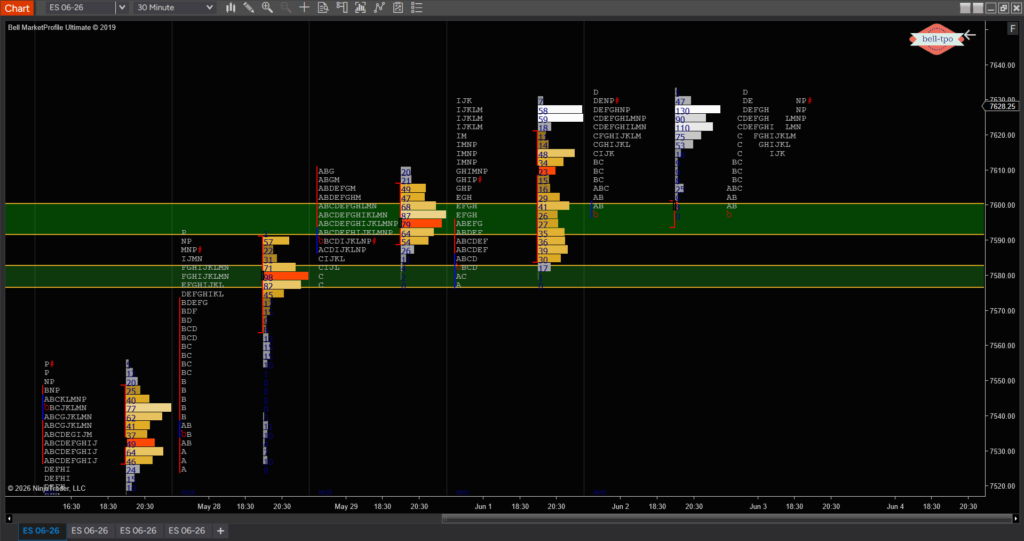
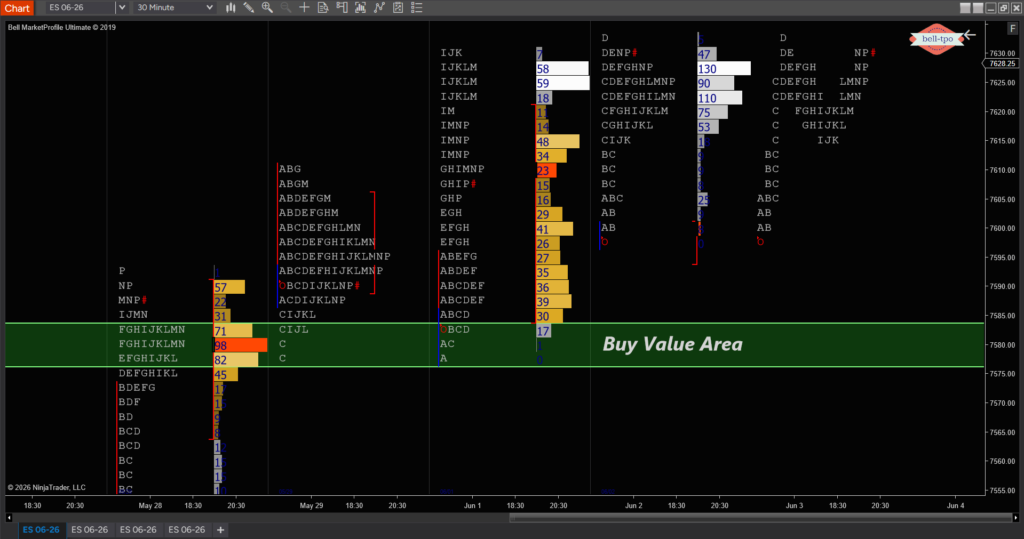
The image above provides a good example.
Notice how the market continuously develops around specific areas of value. These green zones represent important locations where the auction found acceptance. Instead of viewing these levels as simple support and resistance, we view them as areas where the market has already demonstrated agreement.
That information becomes extremely valuable when future sessions revisit those locations.
This process is one of the core concepts taught throughout The Daily $100 Project.
Many traders focus exclusively on entries and exits, but before we can discuss execution, we first need to understand context.
The Daily $100 Project was built around this philosophy.
Before learning advanced Order Flow, Footprint Charts, Delta Analysis, VWAP execution, absorption, or liquidity concepts, traders must first learn how to identify value.
Because value creates context.
Context creates opportunity.
And opportunity creates execution.
Without context, even the best trading setup becomes nothing more than a random decision.
Inside The Daily $100 Project, we go much deeper into how Market Profile works together with Auction Market Theory, VWAP, Volume Profile, Footprint Charts, and Order Flow to create a complete understanding of market behavior.
The goal is not to predict every move.
The goal is to understand the current auction better than the average trader.
Once that happens, the market stops looking random.
And trading starts becoming a process of observation and execution rather than hope and prediction.
1 comment
Very useful information for beginners who are contemplating to become trader. I personally found lots of information about market profile, though I am using it for few months to years, but never understood the concepts explained above. Thank You