 By Anzo Trader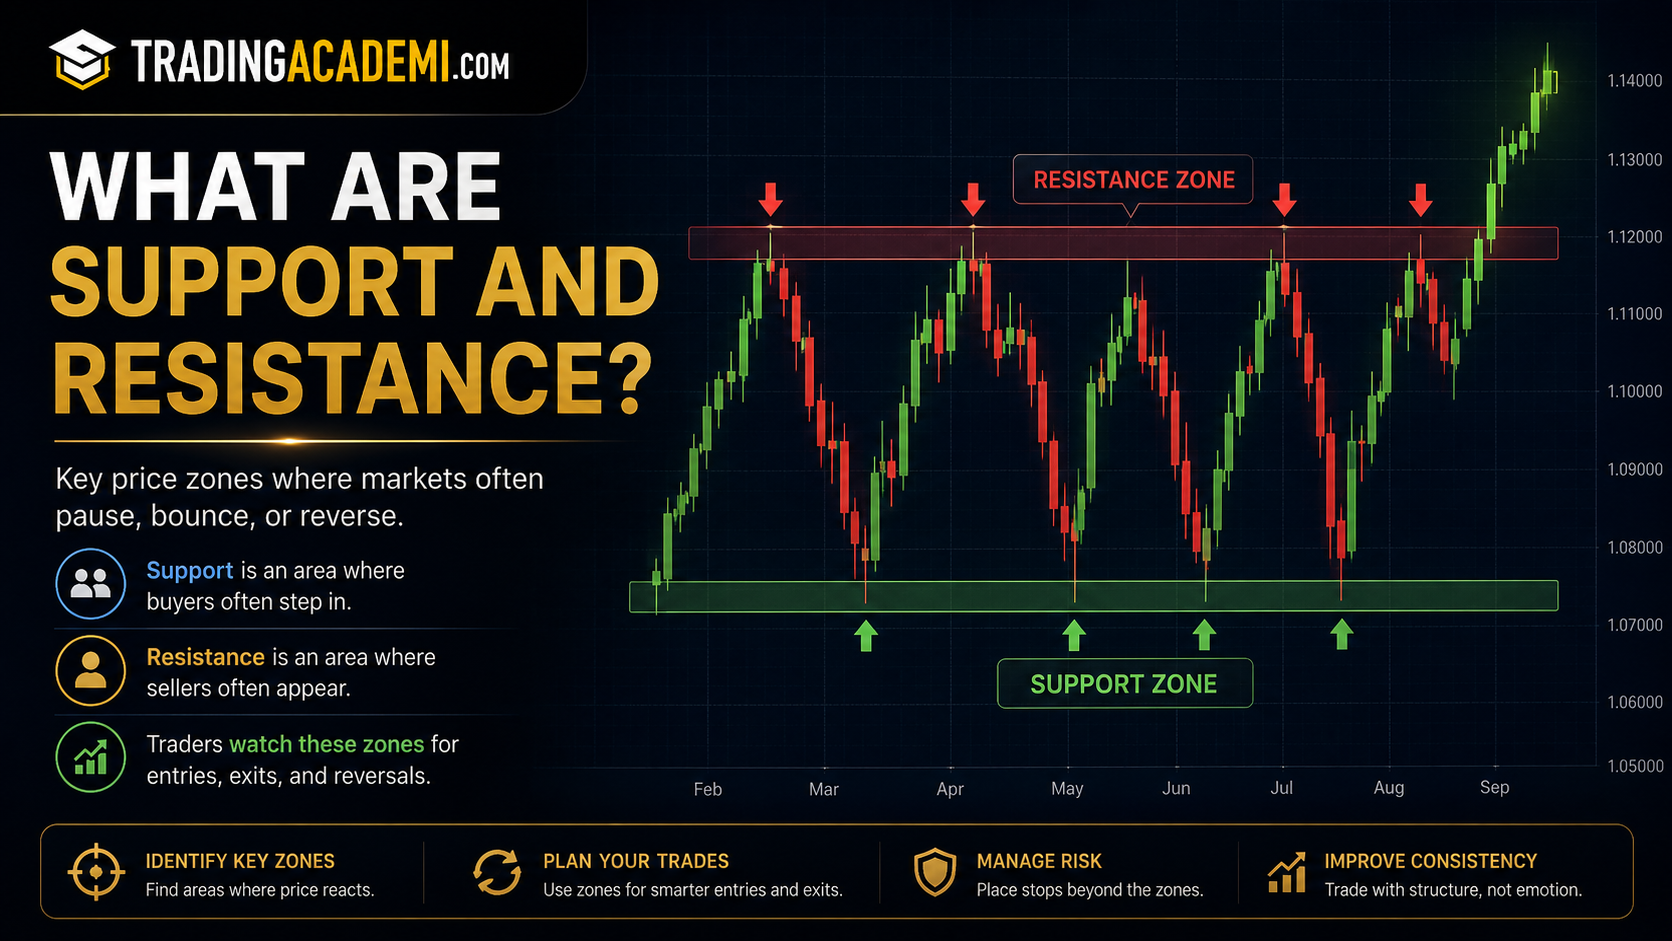
Support and resistance are two of the most important concepts in trading. Almost every beginner hears about them early, but many traders still use them the wrong way.
The basic idea is simple. Markets do not move in a straight line forever. Price moves up, pulls back, reacts, breaks levels, retests zones, and sometimes rejects the same areas more than once. Support and resistance help traders understand where price may react again based on previous buying and selling activity.
Support is an area where buyers may become active. Resistance is an area where sellers may become active. These levels are not magic, and they do not guarantee that price will reverse. They are simply areas where traders expect a possible reaction because the market has reacted there before.
If you understand support and resistance, you can read charts better, plan entries more clearly, place stop losses with more logic, and avoid entering trades randomly. These concepts also connect directly with bullish and bearish market direction, long and short trades, and breakouts, pullbacks, trends, and ranges.
What Are Support and Resistance?
Support and resistance are price areas where the market has shown a reaction before.
A support area is usually below the current price. It is an area where price may stop falling because buyers become interested. A resistance area is usually above the current price. It is an area where price may stop rising because sellers become interested.
For example, if price keeps falling near the same zone and then bounces back up, traders may call that zone support. If price keeps rising near the same zone and then drops back down, traders may call that zone resistance.
The important word here is area. Many beginners draw support and resistance as exact lines, but real markets are often messy. Price may react a little above or below the same level. That is why it is usually better to think in zones instead of perfect lines.
What Is Support?
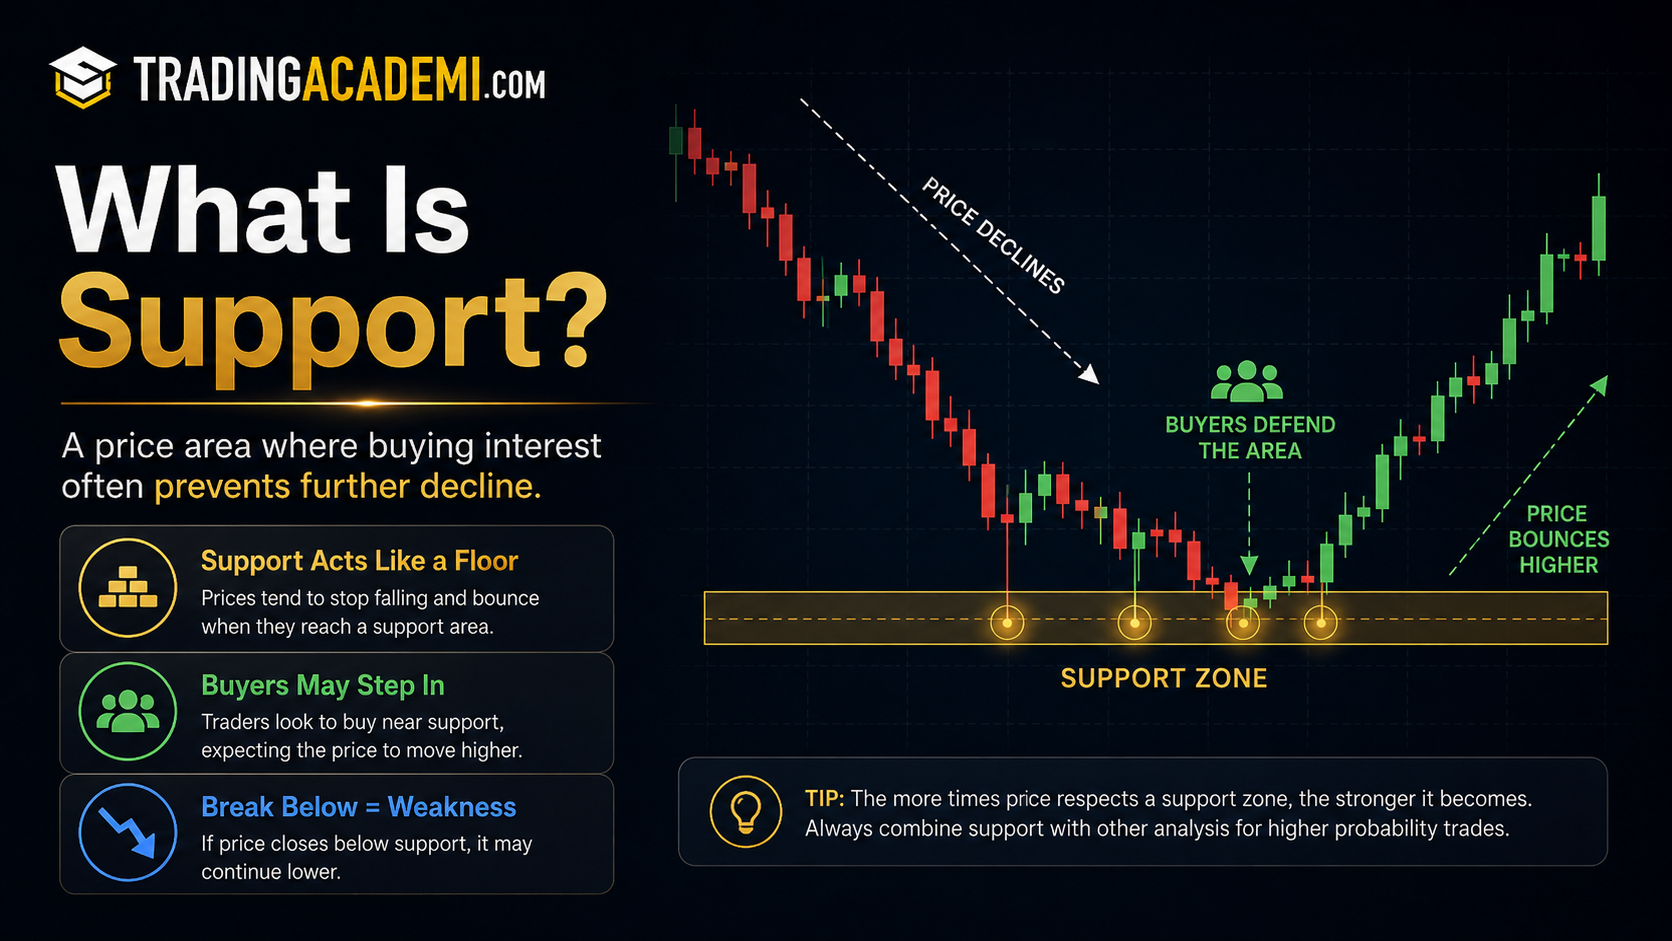
Support is a price area where buying pressure may appear and slow down or stop a decline.
Imagine price is falling, but every time it reaches around $100, buyers start entering and price moves back up. After this happens more than once, traders may see $100 as a support zone.
Support exists because some traders see the price as attractive in that area. Buyers may believe the asset is cheap enough to buy. Traders who missed the previous move may wait for a pullback to that level. Short sellers may also close their positions near support, which can add more buying pressure.
This does not mean support will always hold. If selling pressure becomes stronger than buying pressure, price can break below support. But until that happens, support is an area where traders watch for possible bullish reactions.
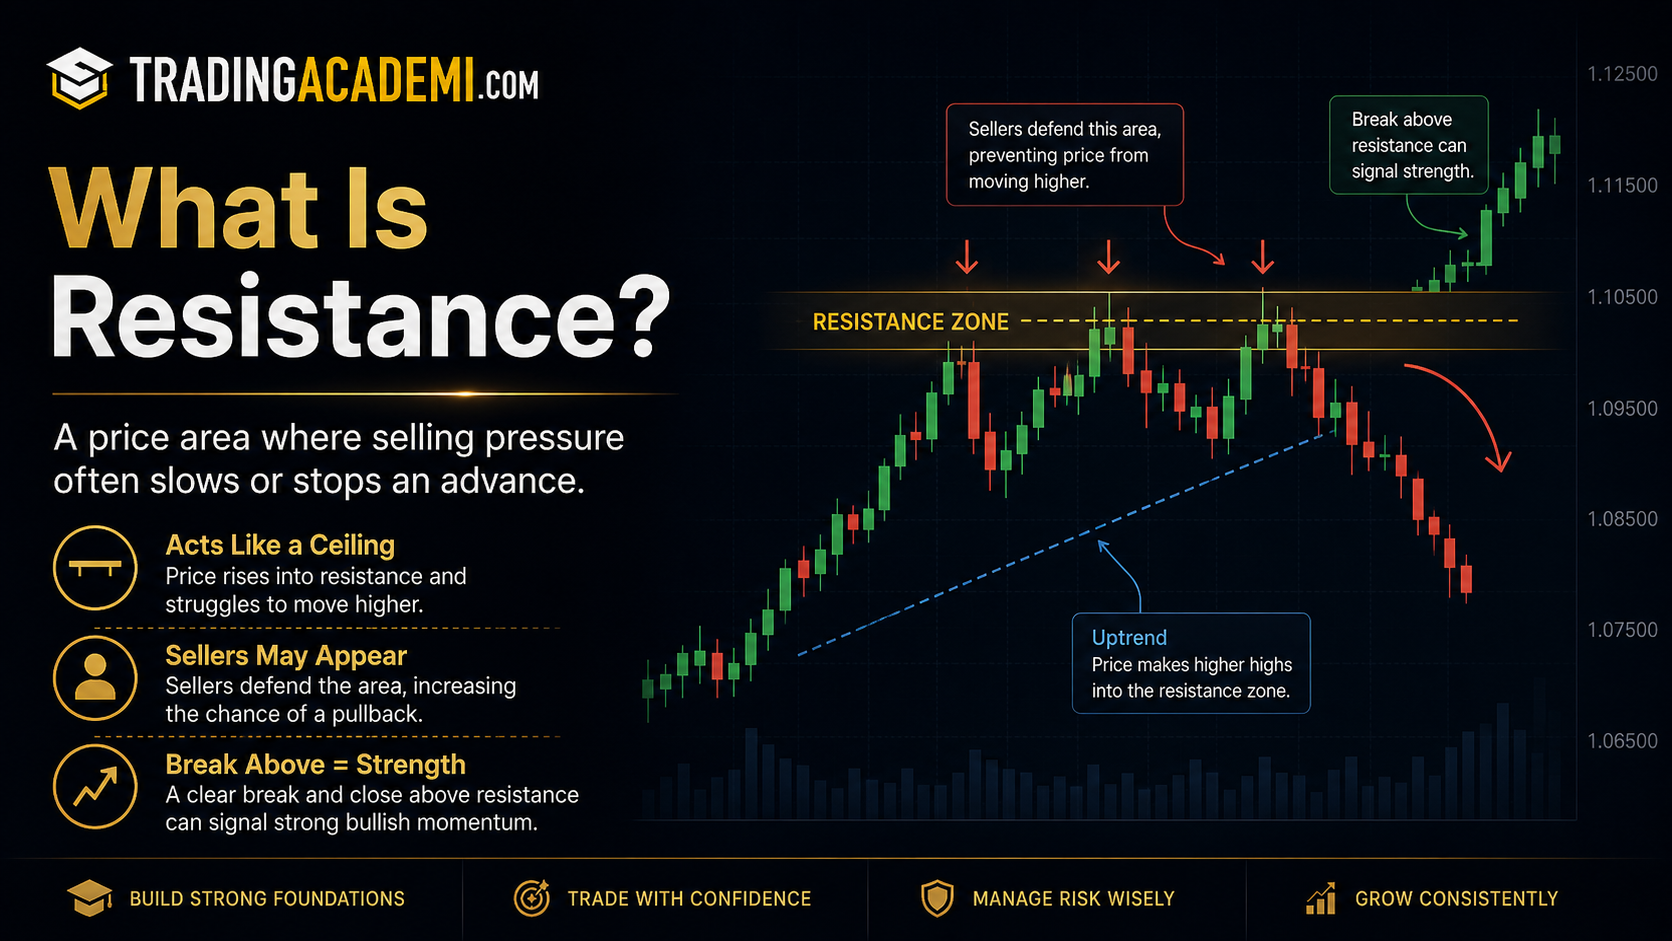
What Is Resistance?
Resistance is a price area where selling pressure may appear and slow down or stop a rally.
For example, if price rises toward $120 several times but fails to continue higher, traders may see $120 as a resistance zone. In that area, sellers may become active, buyers may take profit, and some traders may open short positions.
Resistance often forms because the market remembers previous reactions. Traders who bought lower may decide to take profit near resistance. Traders who believe the price is too high may sell. Others may wait for a confirmed breakout before buying.
Like support, resistance is not guaranteed to hold. If buyers become stronger than sellers, price can break above resistance and continue higher.
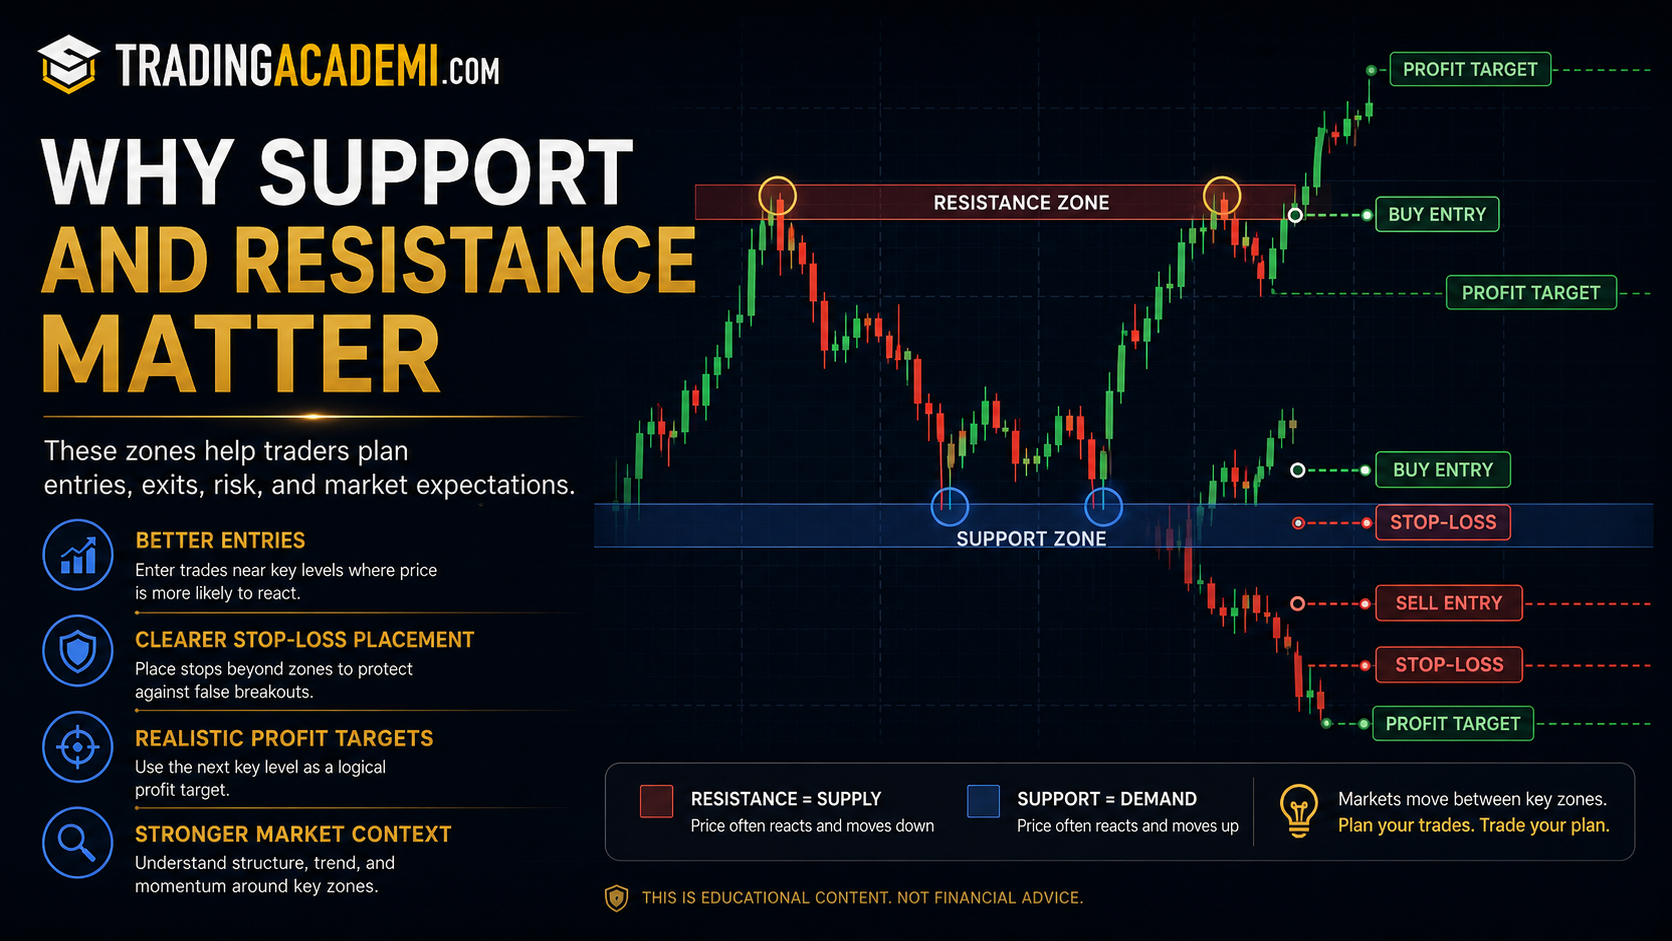
Why Support and Resistance Matter
Support and resistance matter because they help traders avoid random decisions.
Instead of buying anywhere on the chart, a trader may wait for price to reach a support zone and then look for confirmation. Instead of selling randomly, a trader may wait for price to approach resistance and watch how the market reacts.
These levels can help with entries, exits, stop loss placement, profit targets, and trade planning. For example, a trader who wants to go long may look for a buying opportunity near support. A trader who is already long may use resistance as a possible profit-taking area.
Support and resistance also help traders understand risk. If you enter close to a support zone, you may place your stop loss below that zone. If support breaks clearly, the reason for the trade may no longer be valid. This connects directly with risk management, because a good trade idea still needs a clear invalidation point.
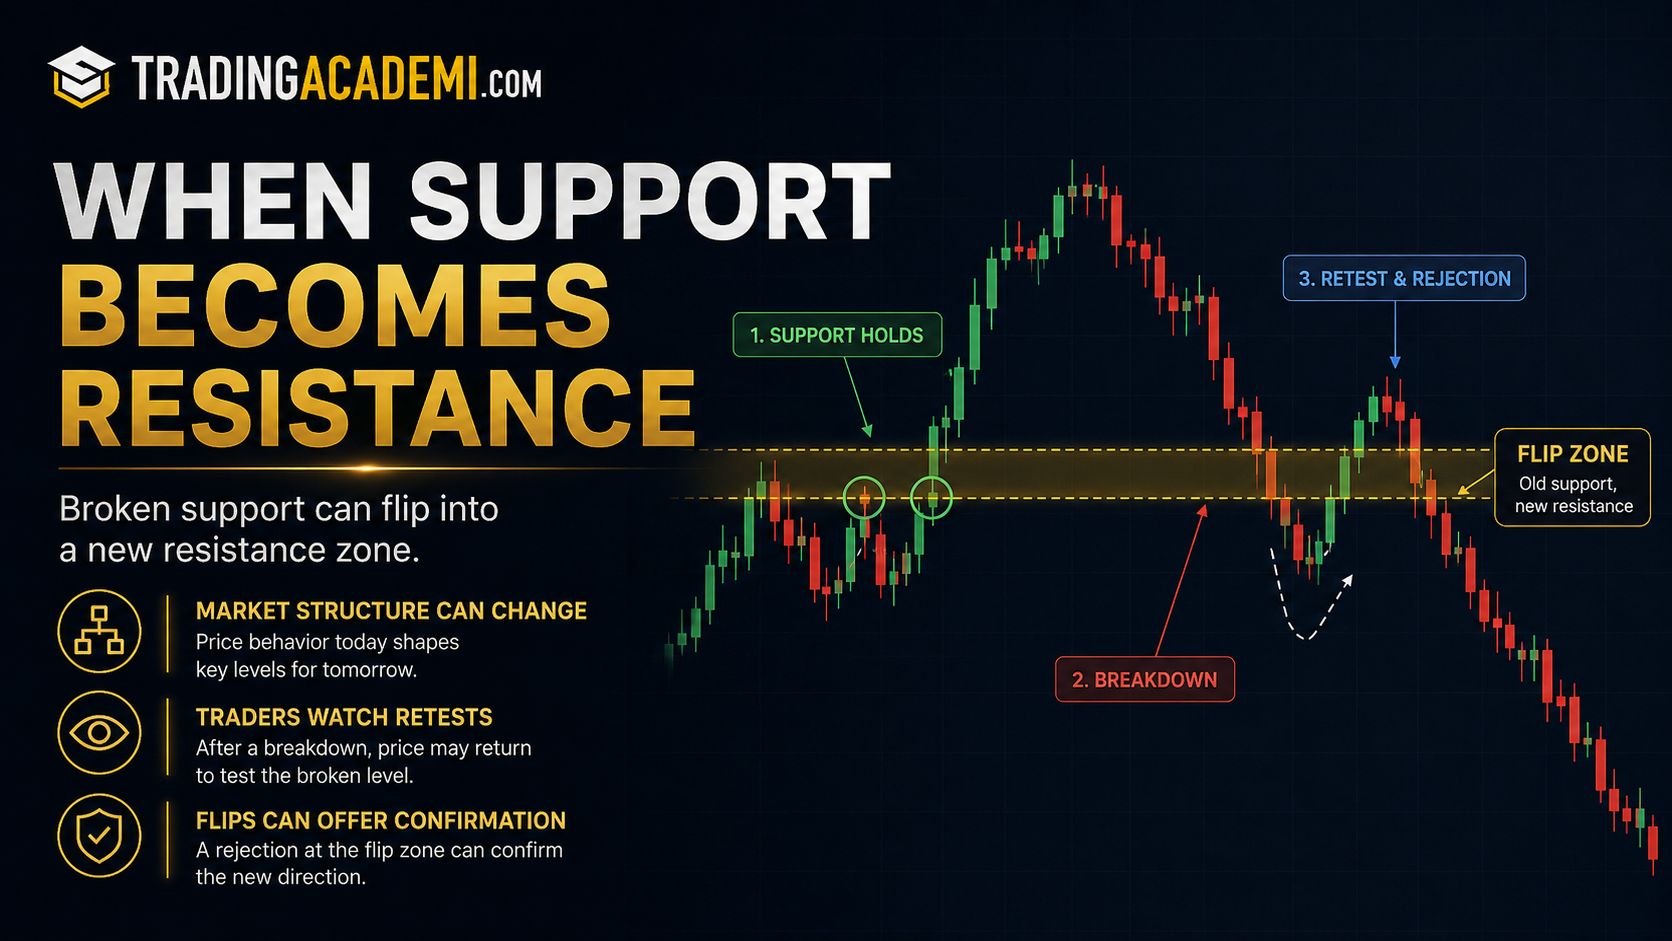
How Support Becomes Resistance
One important concept is that support can become resistance after it breaks.
Imagine price is moving above a support zone for a long time. Buyers keep defending that area, and traders believe the level is important. But one day, price breaks below it. After the break, that same zone may become resistance if price comes back to retest it.
This happens because market psychology changes. Traders who bought near support may now be trapped in losing positions. If price returns to the old support zone, some of them may sell to exit at breakeven or reduce losses. New sellers may also enter because the broken support now looks like a bearish level.
This is why traders often watch old support after a breakdown. If price retests it and rejects, it may confirm that the market has shifted from buyers defending the area to sellers controlling it.
How Resistance Becomes Support
Resistance can also become support after a breakout.
Imagine price struggles many times to break above $120. Sellers keep defending the area, and buyers fail to push through. Then one day, price breaks above $120 with strength. After that, if price pulls back to the same zone and holds, traders may see the old resistance as new support.
This happens because the breakout changes market perception. Traders who were waiting for confirmation may now become buyers. Traders who sold near resistance may close their shorts if price stays above the level. This can create buying pressure around the old resistance zone.
This is one reason why traders do not always buy the first breakout immediately. Some prefer to wait for a pullback to the broken resistance, then look for confirmation that the level is now acting as support.
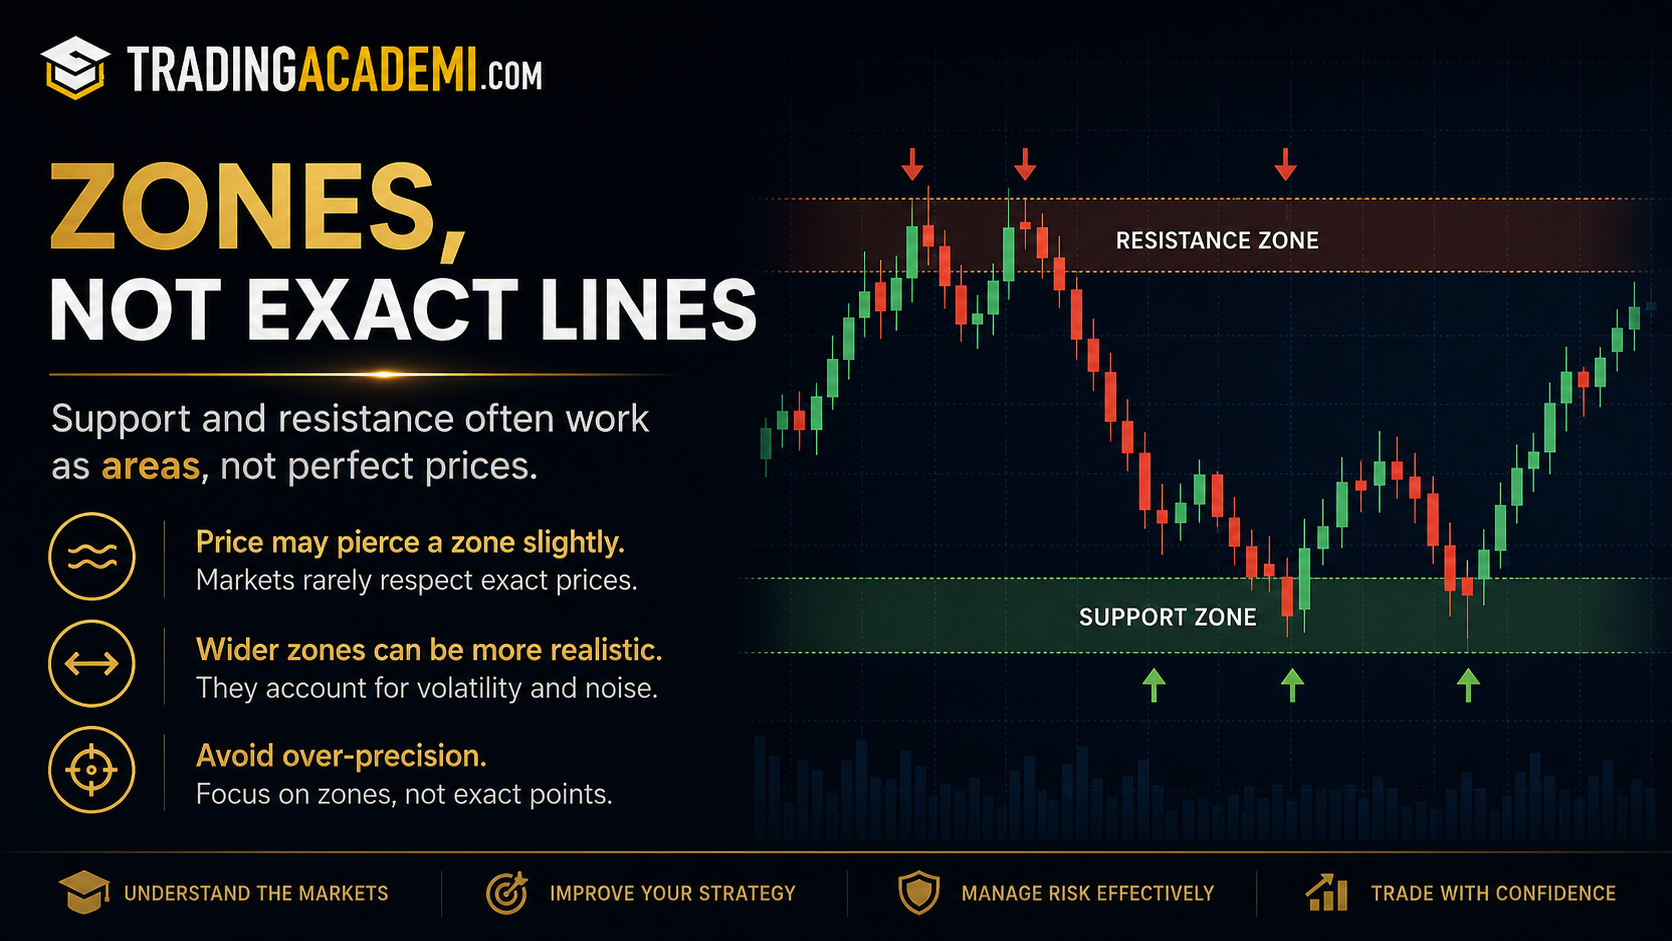
Support and Resistance Zones vs Exact Lines
A common beginner mistake is treating support and resistance like exact numbers.
In real trading, price does not always stop perfectly at one line. It may go slightly above resistance before rejecting. It may dip slightly below support before bouncing. This does not always mean the level failed. Sometimes the market is simply testing liquidity around that zone.
That is why many traders prefer zones. A zone gives price a little space to react naturally. Instead of saying “support is exactly $100,” a trader may say “support is around $99.50 to $100.50.”
Zones are more realistic because markets are driven by orders, liquidity, emotions, and execution. Price can move through exact levels temporarily before showing the real direction.
Breakouts and Failed Breakouts
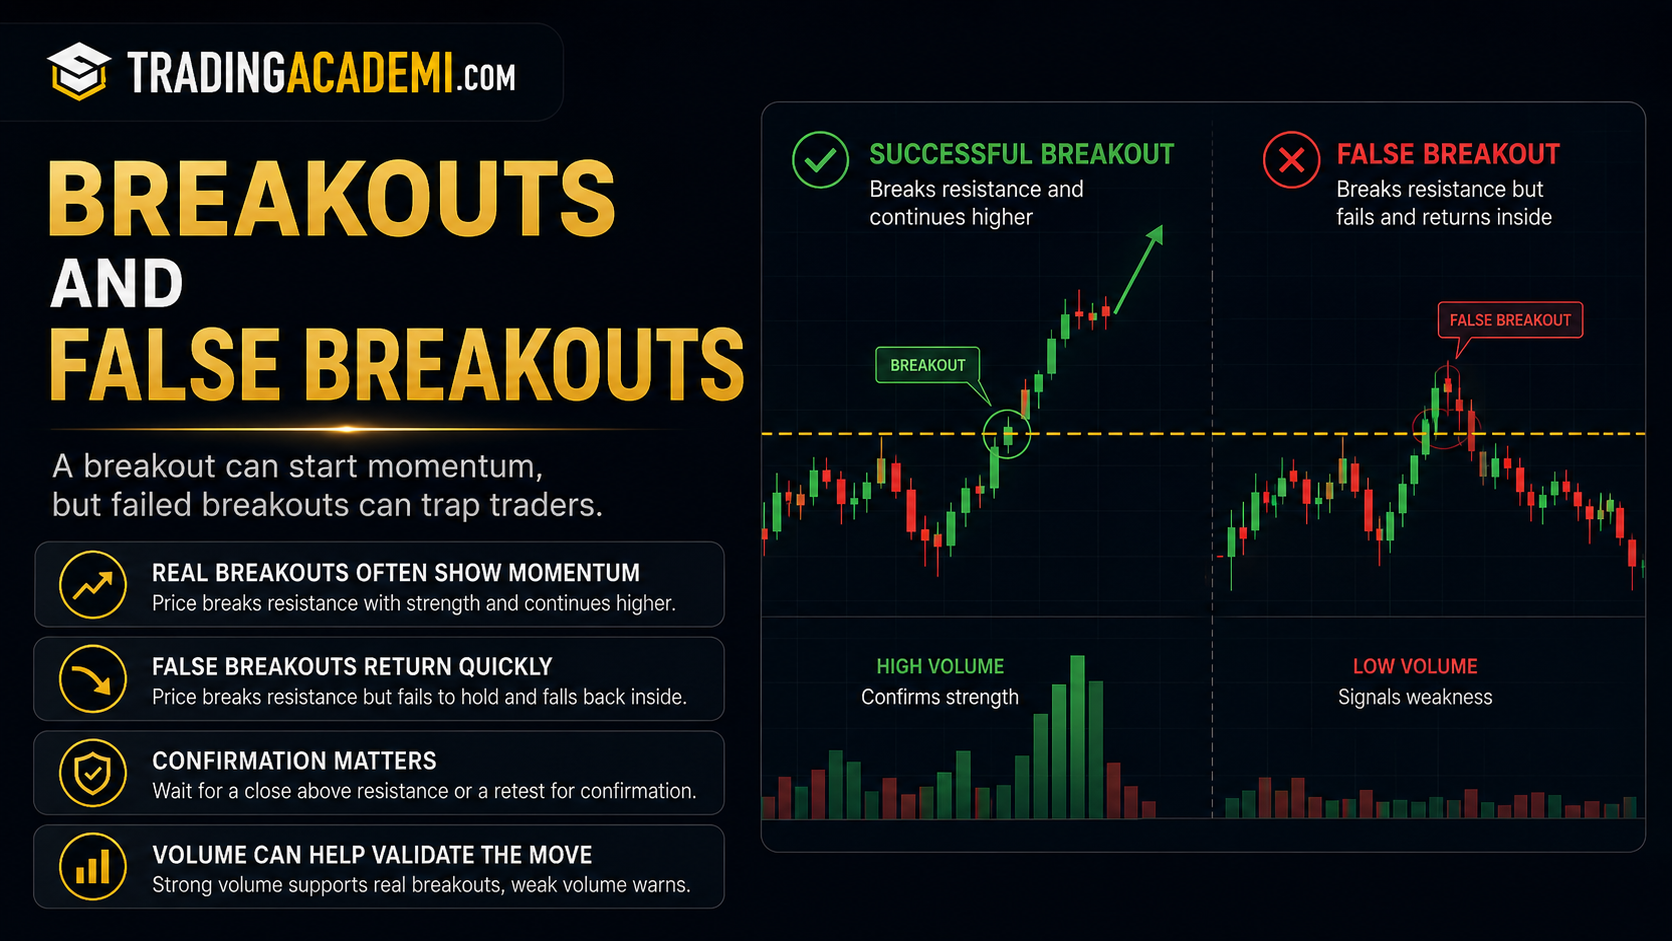
A breakout happens when price moves beyond a support or resistance level.
If price breaks above resistance, traders may see it as a bullish signal. If price breaks below support, traders may see it as a bearish signal. But not every breakout continues. Sometimes price breaks a level, attracts traders, then quickly reverses. This is called a failed breakout or false breakout.
False breakouts are common because many traders place orders around obvious levels. Big moves can trigger stop losses, activate breakout orders, and create temporary volatility. After that, price may return inside the previous range.
This is why beginners should not trust every breakout immediately. A breakout is stronger when it comes with confirmation, strong market structure, volume support, or a clean retest. You can connect this with bid, ask, spread, volume, and liquidity, because low liquidity and wide spreads can make breakouts less reliable.
Pullbacks to Support or Resistance
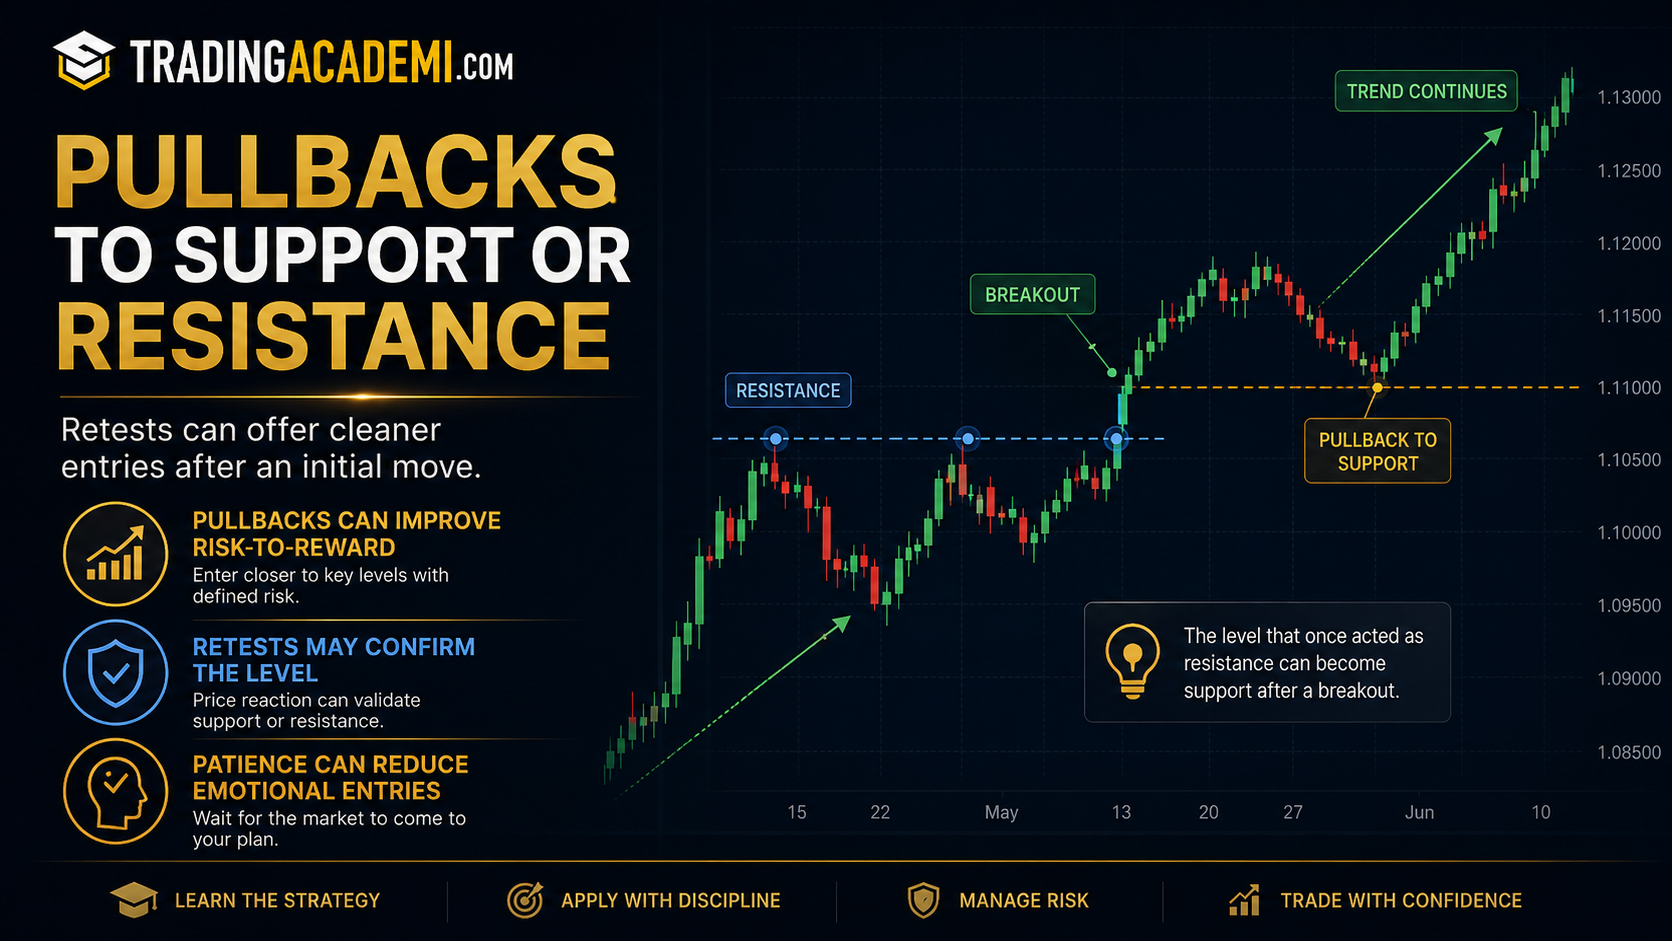
A pullback is a temporary move against the main direction.
In an uptrend, price may break resistance, move higher, then pull back to the old resistance zone. If that zone holds as support, traders may see it as a possible long setup. In a downtrend, price may break support, move lower, then pull back to the old support zone. If that zone acts as resistance, traders may see it as a possible short setup.
Pullbacks are popular because they can give traders a better entry than chasing price. Instead of buying after a big move, a trader waits for price to return to an important level and then watches for a reaction.
This does not mean every pullback is a good trade. The trader still needs confirmation, a clear stop loss, and a realistic target.
How Traders Use Support and Resistance
Traders use support and resistance in different ways depending on their strategy.
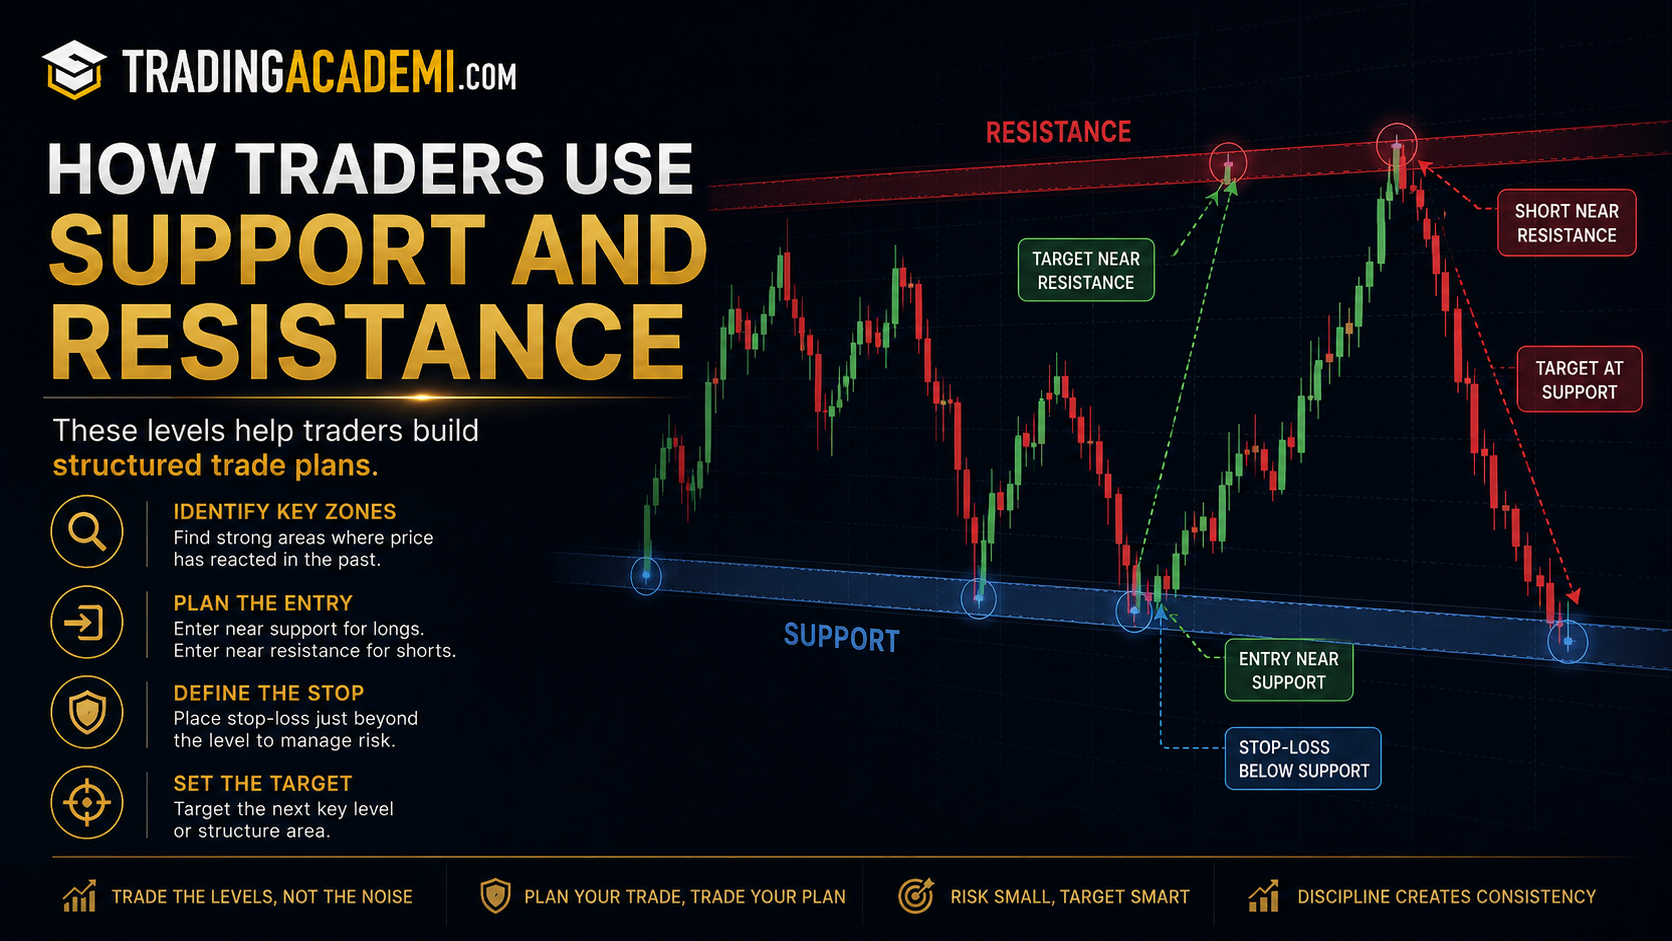
Some traders use support to look for buying opportunities. They wait for price to reach a support zone, then look for signs that buyers are defending it. Other traders use resistance to look for selling opportunities when price struggles to move higher.
Breakout traders use support and resistance differently. They may wait for price to break above resistance before going long, or break below support before going short. Some traders also wait for a retest after the breakout to avoid chasing.
Support and resistance can also help with exits. A trader who buys near support may use the next resistance zone as a possible target. A trader who sells near resistance may use the next support zone as a possible target.
The key is not to use these levels alone. Support and resistance work better when combined with trend direction, volume, price action, order type, and risk management.
Support and Resistance in Trending Markets
In a trending market, support and resistance often appear as steps.
In an uptrend, old resistance levels may become new support as price continues higher. This creates a staircase-like movement where buyers keep defending higher levels. Traders call this higher highs and higher lows.
In a downtrend, old support levels may become new resistance as price continues lower. This creates lower highs and lower lows, showing that sellers are still in control.
Understanding this helps beginners avoid trading against the main trend too early. If the market keeps making higher highs and holding support, selling every resistance may be risky. If the market keeps making lower lows and rejecting resistance, buying every support may also be risky.
Support and Resistance in Range Markets
In a range market, price moves sideways between support and resistance.
Support forms near the lower part of the range, where buyers tend to appear. Resistance forms near the upper part of the range, where sellers tend to appear. Range traders may look to buy near support and sell near resistance, but only if the range remains valid.
The danger in ranges is that price can eventually break out. A trader who buys support without a stop loss may be in trouble if support breaks. A trader who sells resistance without a plan may be in trouble if price breaks higher.
This is why support and resistance should always be connected to risk management. Levels are useful, but they are not guarantees.
Common Beginner Mistakes
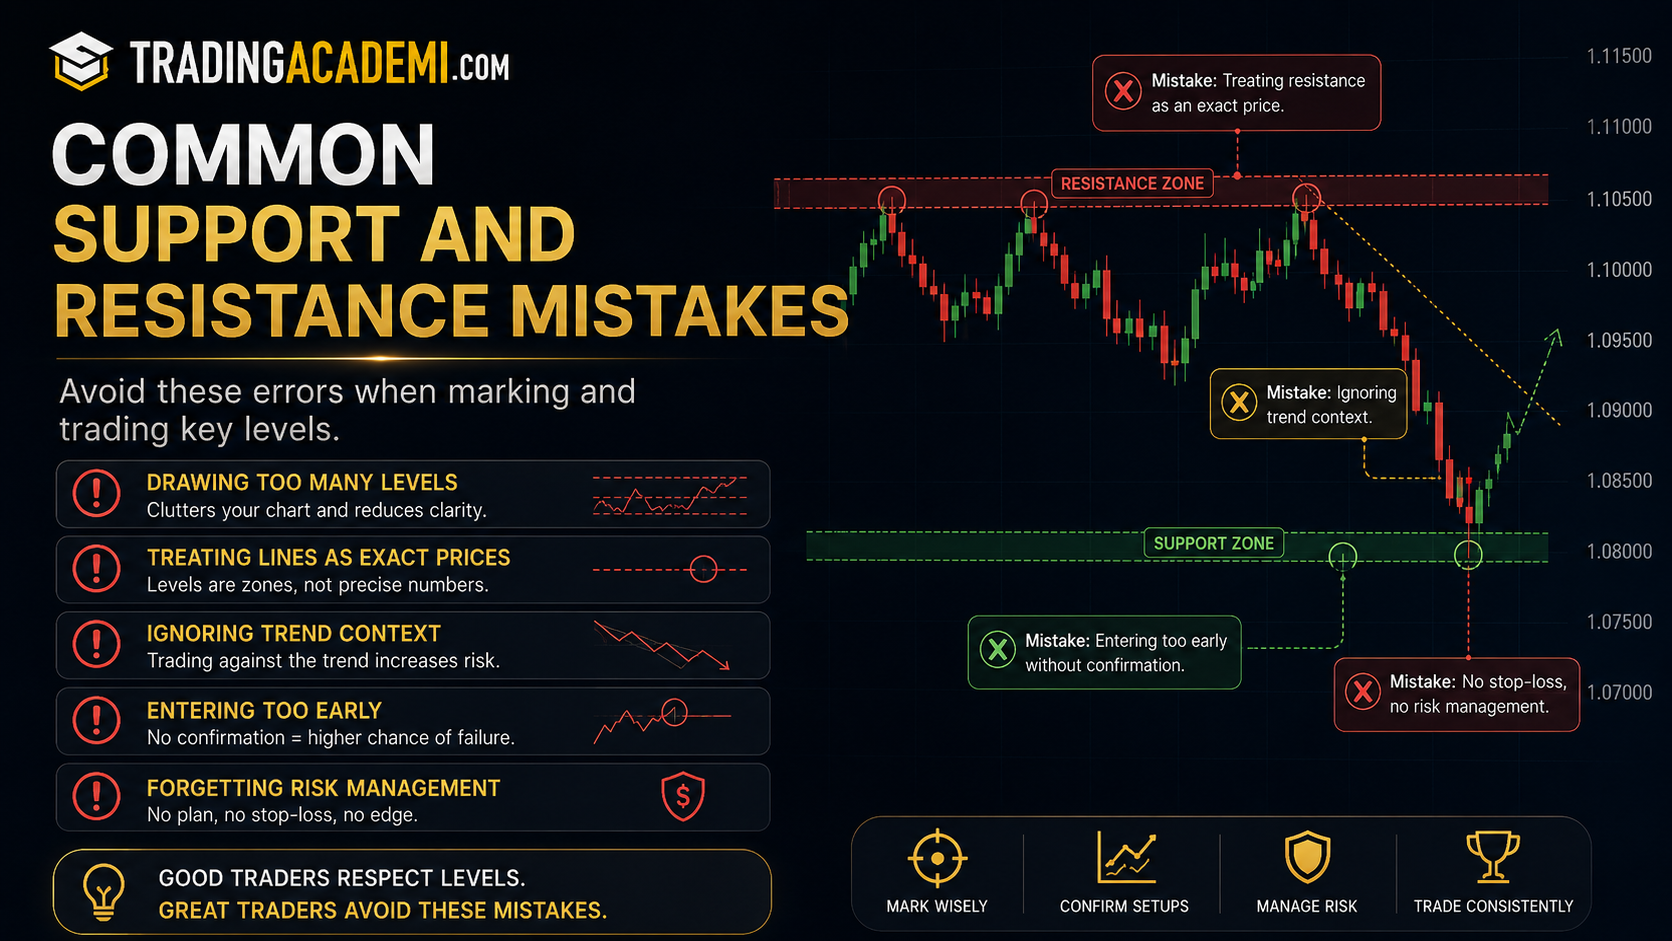
Many beginners draw too many levels on the chart. When every price becomes support or resistance, the chart becomes confusing and the levels lose meaning. It is better to focus on the clearest zones where price reacted strongly or reacted multiple times.
Another mistake is assuming that support and resistance always reverse price. Sometimes a level holds, sometimes it breaks, and sometimes price moves slightly beyond it before reacting. Beginners should avoid treating these zones like fixed walls.
Some traders also enter too early without confirmation. They see price near support and immediately buy, or they see price near resistance and immediately sell. A better approach is to wait and watch how price behaves around the zone.
The final mistake is forgetting risk. Even a clean support or resistance setup can fail. That is why every trade needs a stop loss, position sizing, and a clear plan.
Beginner Checklist
Before using support and resistance in a trade, ask yourself a few simple questions.
Is this level clear on the chart? Did price react there before? Is it better to draw this as a zone instead of a line? Is the market trending or ranging? Is price approaching support, resistance, or a broken level retest? Do I have confirmation, or am I guessing? Where is my stop loss if the level fails? Where is my target if the trade works?
This checklist helps you avoid emotional entries. The goal is not to predict every move perfectly. The goal is to build a trade idea with structure, logic, and controlled risk.
Final Thoughts
Support and resistance are simple concepts, but they are powerful when used correctly.
Support is an area where buyers may defend price. Resistance is an area where sellers may defend price. These zones can help traders plan entries, exits, stop losses, profit targets, breakouts, pullbacks, and retests.
The most important thing to remember is that support and resistance are not guaranteed. They are areas of interest, not magic lines. Price can react, break, retest, or fail around them.
A beginner should use support and resistance as part of a full trading plan, not as a standalone signal. When combined with trend direction, volume, order execution, and risk management, these levels can make your trading decisions much more organized.
Educational Disclaimer
This article is for educational purposes only and should not be considered financial advice. Trading and investing involve risk, including the possible loss of capital. Support and resistance levels can fail, and market conditions can change quickly. Always do your own research and consider consulting a qualified financial professional before making financial decisions.