 By Anzo Trader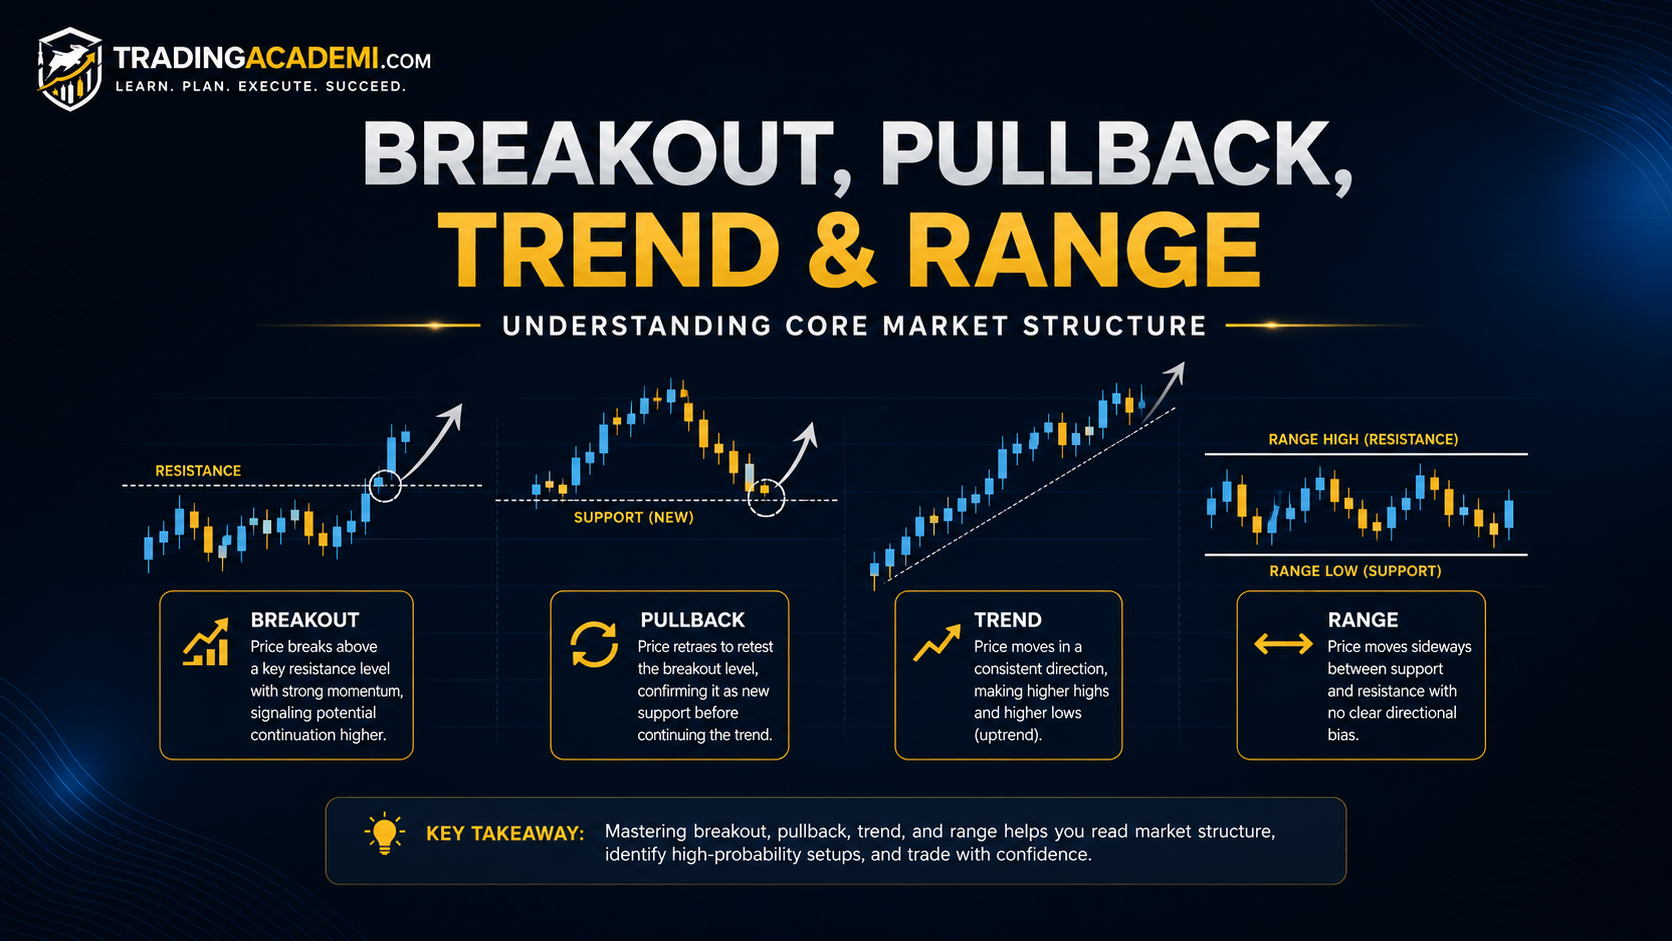
When beginners look at a trading chart, price movement can feel random. One moment price is moving up, then it pulls back. Sometimes it breaks above an important level. Other times it moves sideways for a long time without choosing a clear direction.
To understand this movement, traders often use four important terms: breakout, pullback, trend, and range.
These concepts help you read market structure. They show whether price is moving with strength, taking a temporary pause, continuing in one direction, or moving sideways between two levels. Once you understand them, charts become easier to read because you stop looking at every candle alone and start seeing the bigger picture.
Breakouts, pullbacks, trends, and ranges are closely connected with support and resistance, because most of these patterns happen around key price zones. They also connect with bid, ask, spread, volume, and liquidity, because execution quality and volume can affect how strong or weak a move really is.
What Are Breakouts, Pullbacks, Trends, and Ranges?
Breakouts, pullbacks, trends, and ranges are basic words traders use to describe market behavior.
A breakout happens when price moves beyond an important support or resistance level. A pullback is a temporary move against the current direction. A trend is when price continues moving mostly in one direction over time. A range is when price moves sideways between support and resistance without a clear trend.
These terms are important because they help traders avoid random decisions. Instead of saying “price is going up” or “price is going down,” traders can describe the structure more clearly. They can say price is trending, breaking out, pulling back, or ranging.
This makes trade planning easier. A breakout trader may wait for price to break a key level. A pullback trader may wait for price to return to a better entry area. A trend trader may try to follow the main direction. A range trader may buy near support and sell near resistance.
Each market condition needs a different approach.
What Is a Breakout?
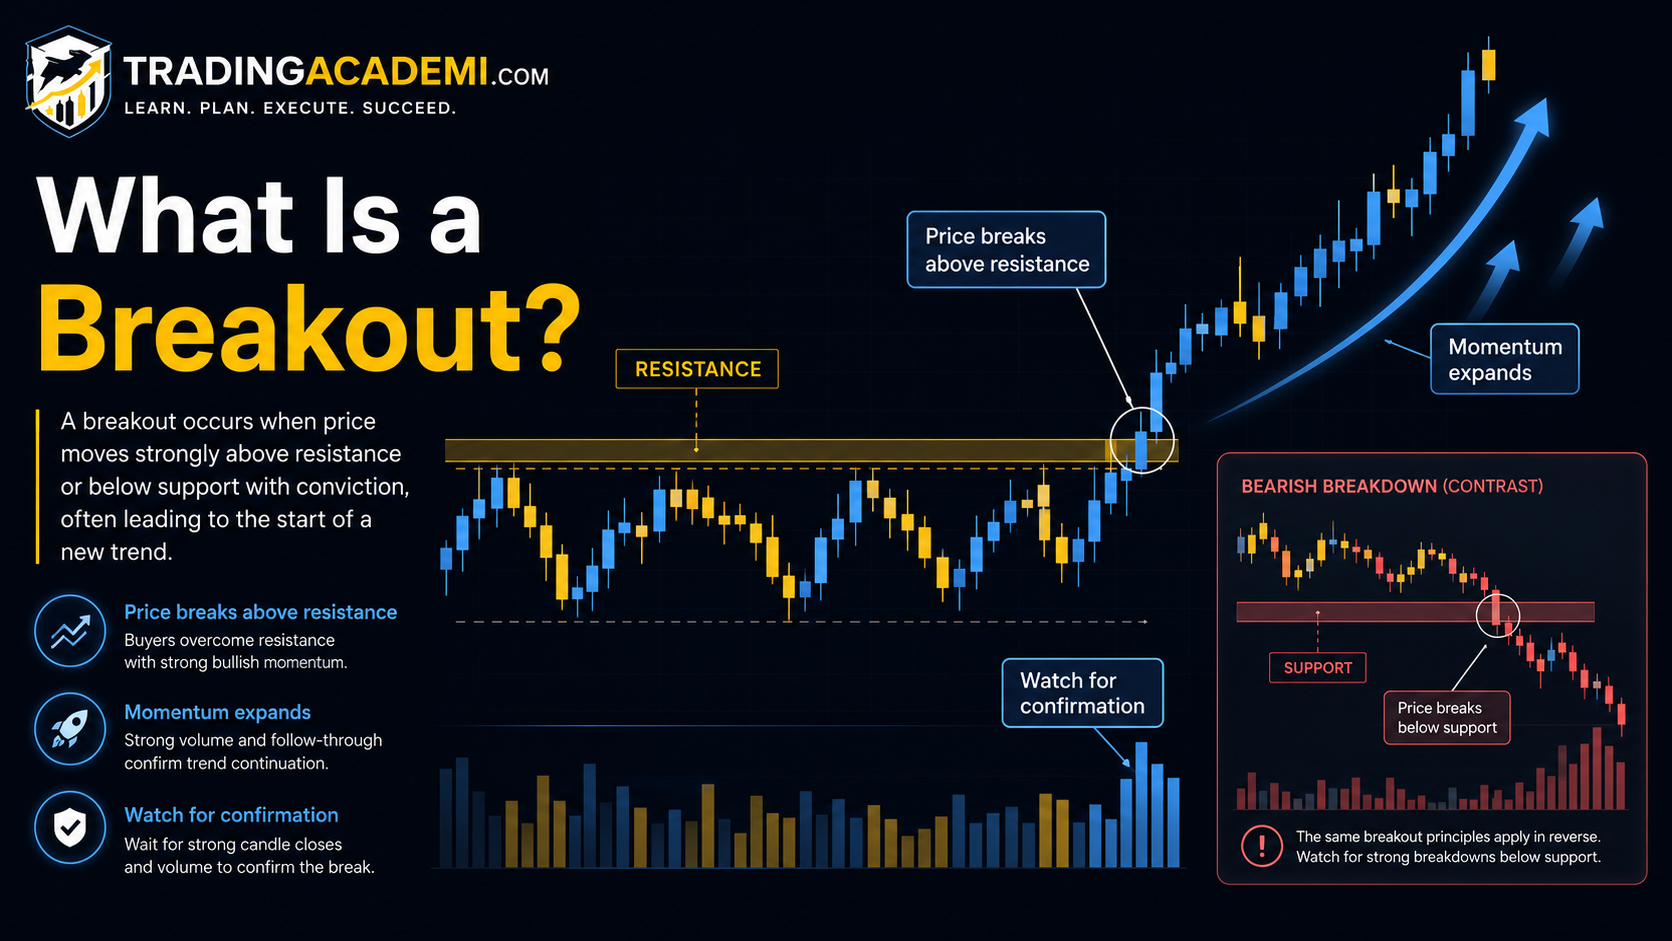
A breakout happens when price moves beyond a key support or resistance level.
For example, if price has been rejected several times near a resistance zone, then finally pushes above it with strength, traders may call that a breakout. If price has been bouncing from support, then breaks below it, that can be a bearish breakout.
A breakout can signal that the market is changing. It may show that buyers have become stronger than sellers, or sellers have become stronger than buyers. This is why many traders watch breakouts carefully.
However, not every breakout is strong. Sometimes price breaks a level for a short time, then quickly returns back inside the previous area. This is called a false breakout. Beginners should be careful not to chase every breakout immediately, especially when there is low volume, weak confirmation, or poor liquidity.
A better breakout usually has context: a clear level, strong momentum, volume support, and a clean close beyond the zone.
What Is a Pullback?
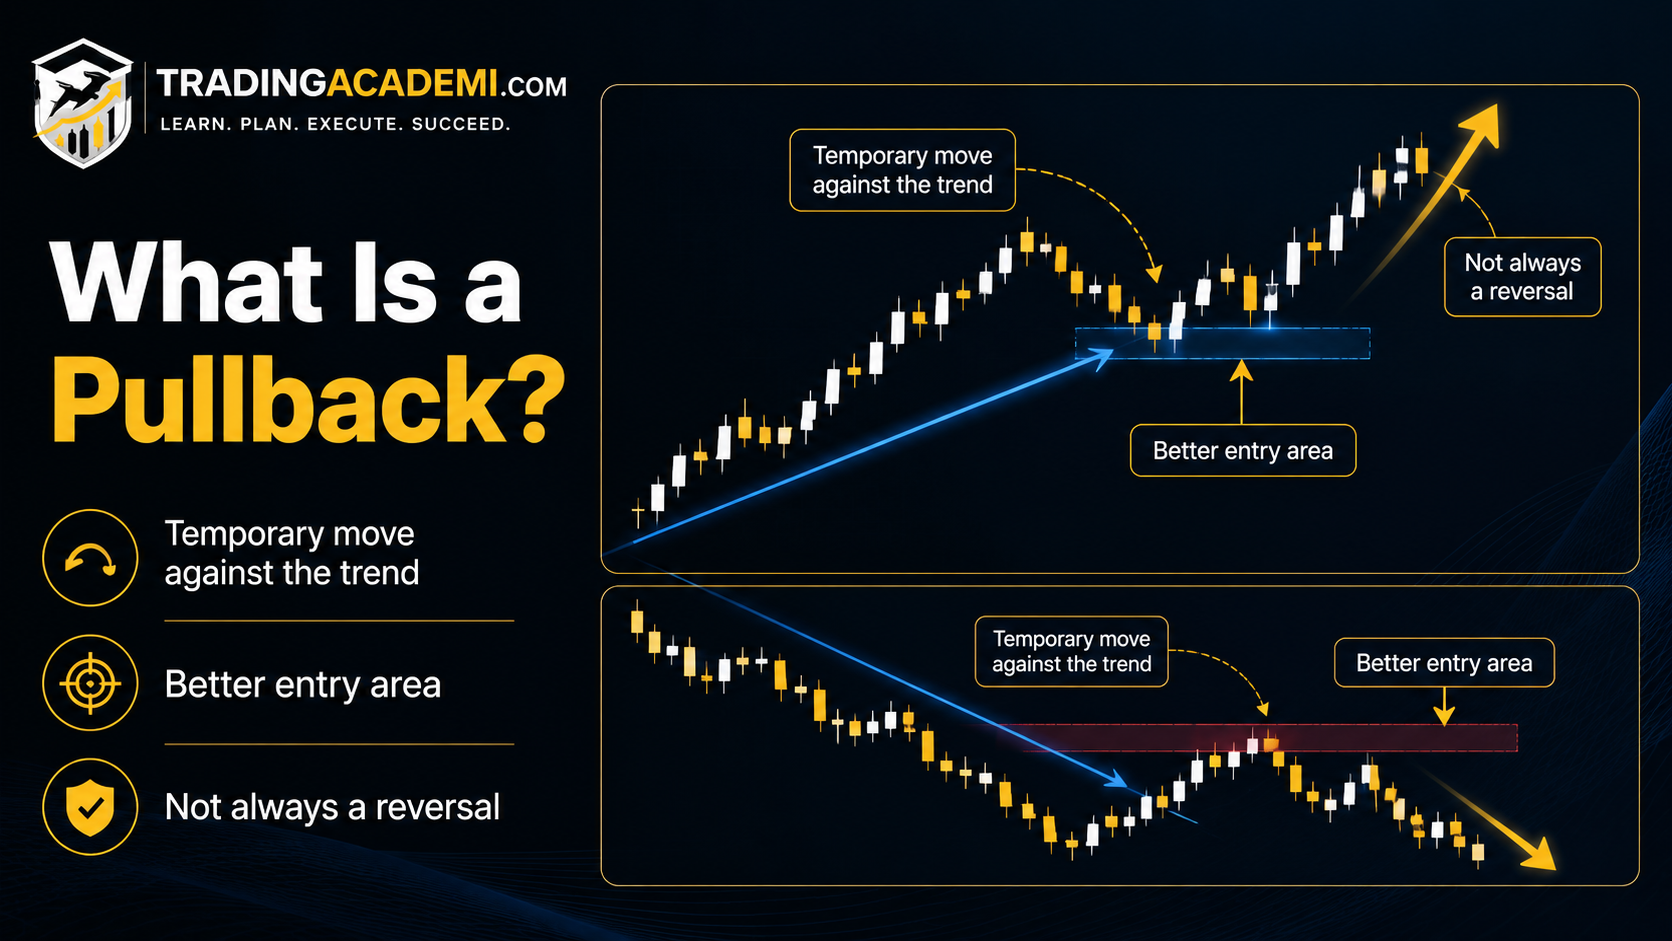
A pullback is a temporary move against the main direction.
If the market is moving up, a pullback is a short move down before price possibly continues higher. If the market is moving down, a pullback is a short move up before price possibly continues lower.
Pullbacks are normal. Markets rarely move in a straight line. Even strong trends need pauses because traders take profit, new traders wait for better entries, and price needs time to find balance.
Many traders prefer pullbacks because they can offer better entries than chasing price after a big move. For example, after a bullish breakout, price may return to the broken resistance zone. If that zone holds as support, it may give traders a cleaner entry with a more logical stop loss.
The key is that a pullback should not be confused with a full reversal. A pullback is temporary. A reversal means the market direction may be changing completely.

What Is a Trend?
A trend is a market condition where price continues moving mostly in one direction.
An uptrend means price is generally moving higher. A downtrend means price is generally moving lower. Trends are important because trading with the main direction can often be easier than fighting against it.
In a trend, price does not move in a straight line. It usually moves in waves. In an uptrend, price makes pushes higher, then pullbacks, then pushes higher again. In a downtrend, price moves lower, then pulls back upward, then continues lower.
Traders use trends to understand market bias. If the market is in an uptrend, traders may look for long opportunities near support or after pullbacks. If the market is in a downtrend, traders may look for short opportunities near resistance or after bearish pullbacks.
A trend can continue for a long time, but it can also weaken and turn into a range or reversal. That is why traders should always combine trend analysis with risk management.
What Is an Uptrend?
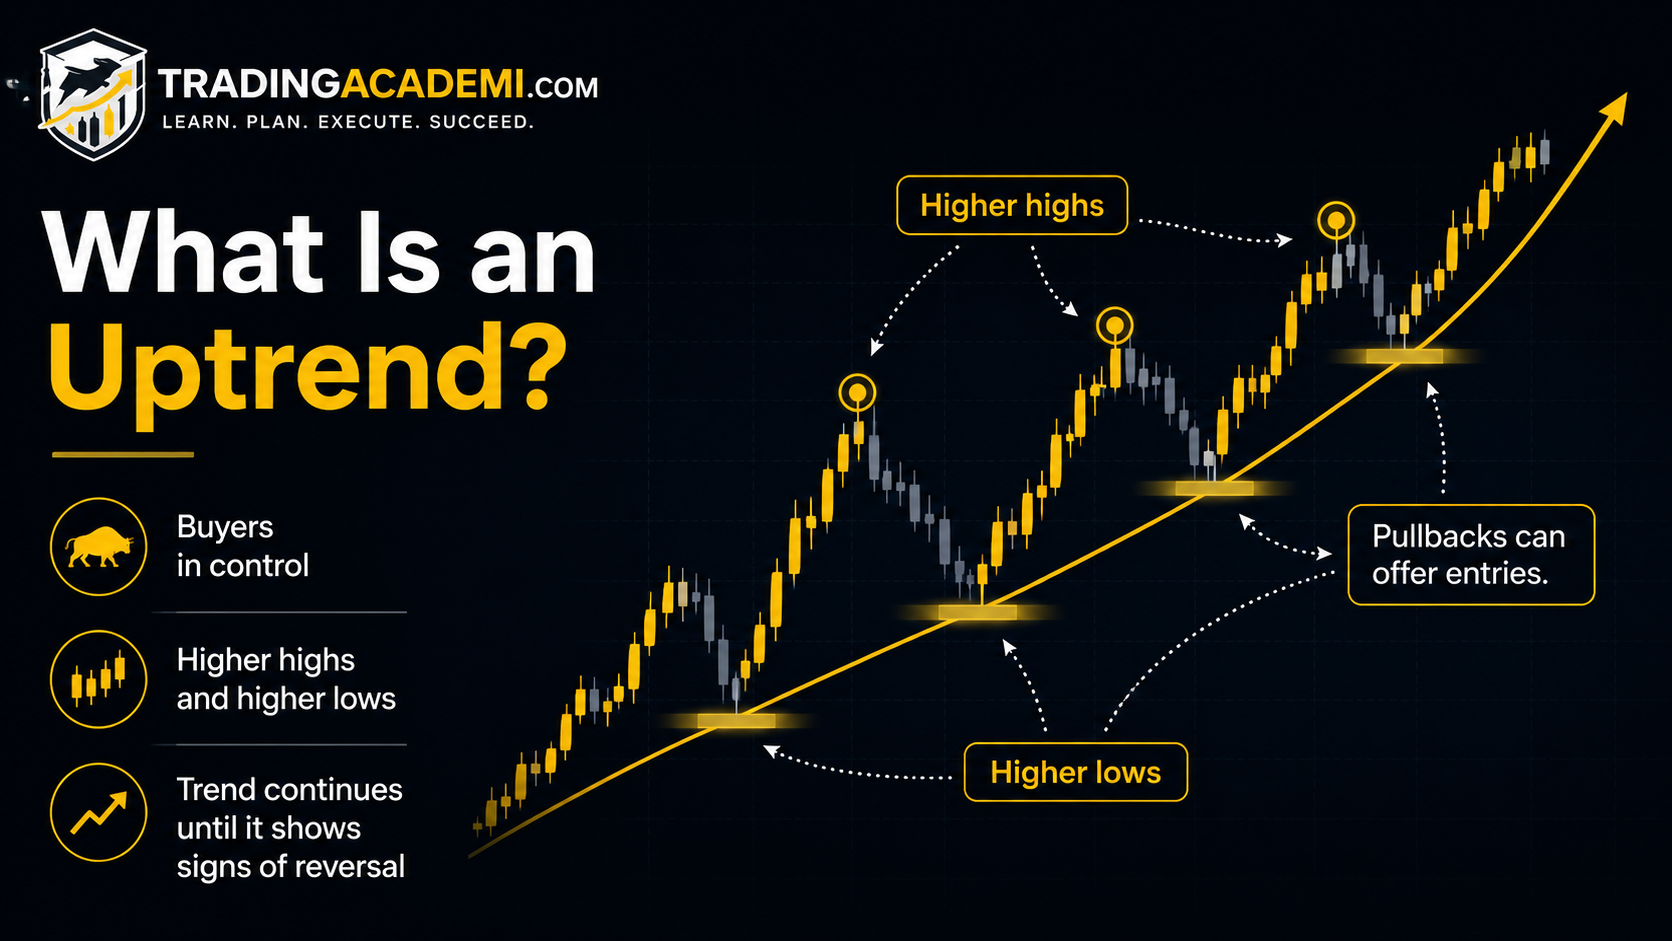
An uptrend is when price makes a series of higher highs and higher lows.
A higher high means price breaks above a previous peak. A higher low means price pulls back but stays above the previous low. Together, these show that buyers are still in control.
In simple terms, an uptrend shows that demand is stronger than supply. Buyers keep stepping in at higher prices, and sellers are not strong enough to push price below previous lows.
Many traders look to buy pullbacks during an uptrend. They may wait for price to return to a support zone, moving average, trendline, or previous resistance that became support. The goal is not to buy randomly, but to join the trend from a better level.
Still, an uptrend does not guarantee profits. If price breaks below important higher lows, the trend may weaken or reverse.
What Is a Downtrend?
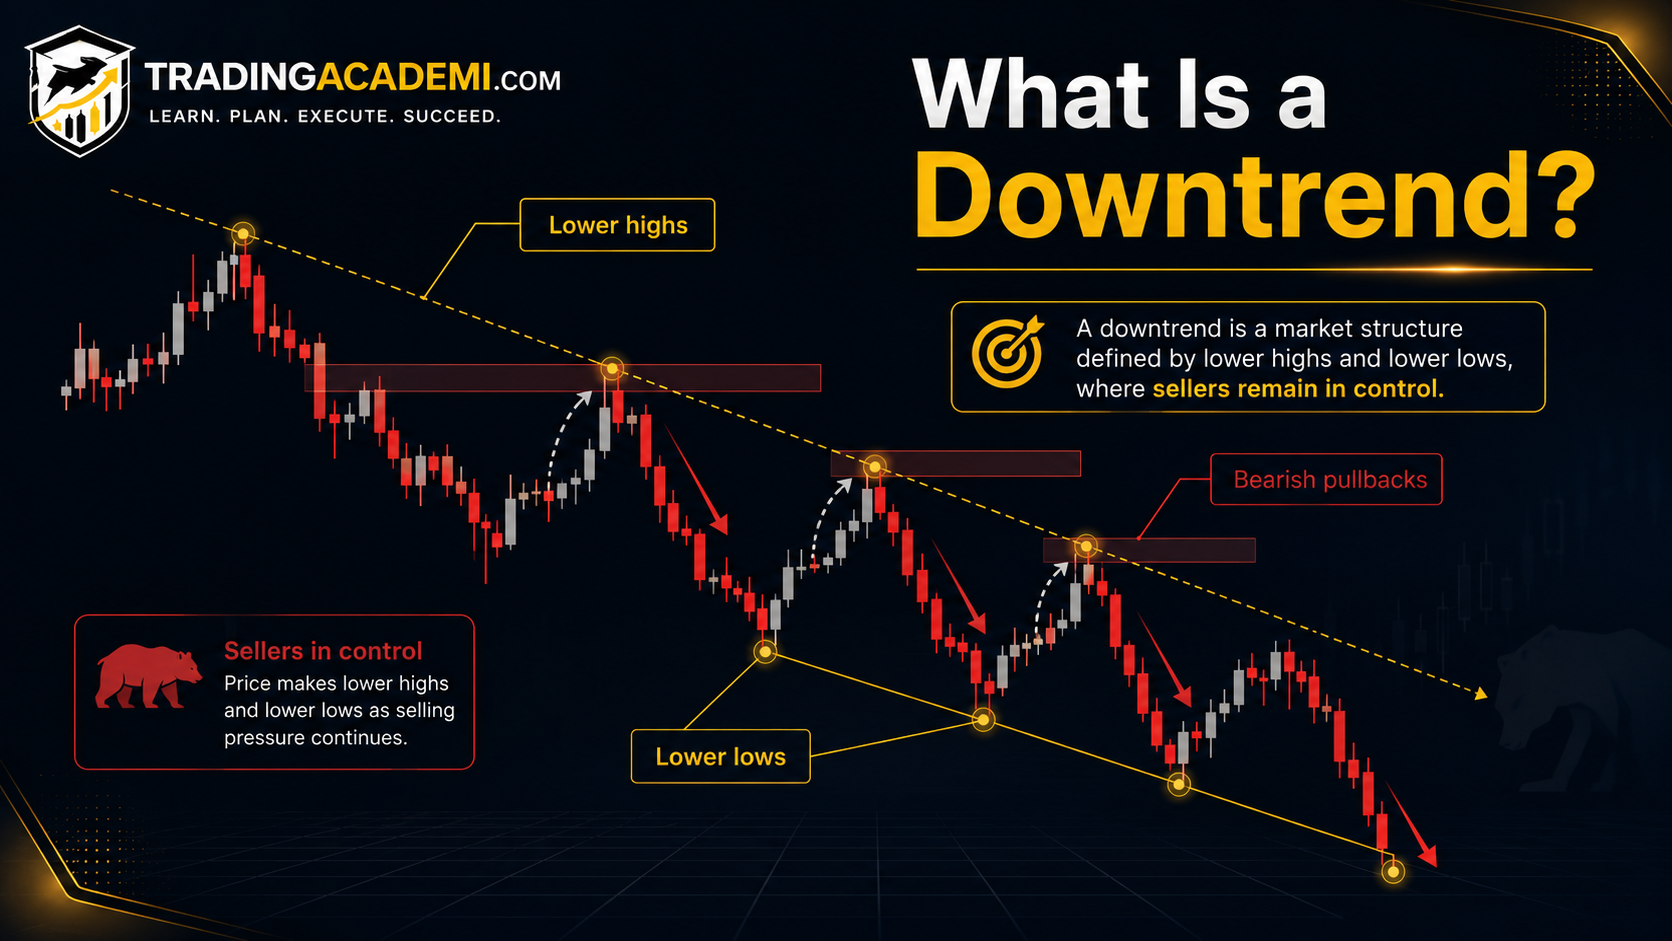
A downtrend is when price makes a series of lower highs and lower lows.
A lower low means price breaks below a previous bottom. A lower high means price pulls back upward but fails to reach the previous high. Together, these show that sellers are still in control.
In a downtrend, supply is stronger than demand. Sellers keep pushing price lower, and buyers are not strong enough to create a lasting recovery.
Traders who short markets may look for selling opportunities during pullbacks. For example, if price breaks support and then retests it as resistance, that pullback can offer a possible short setup.
Beginners should be careful when buying during a strong downtrend. A price bounce can look attractive, but it may only be a temporary pullback before the market continues lower.
What Is a Range Market?
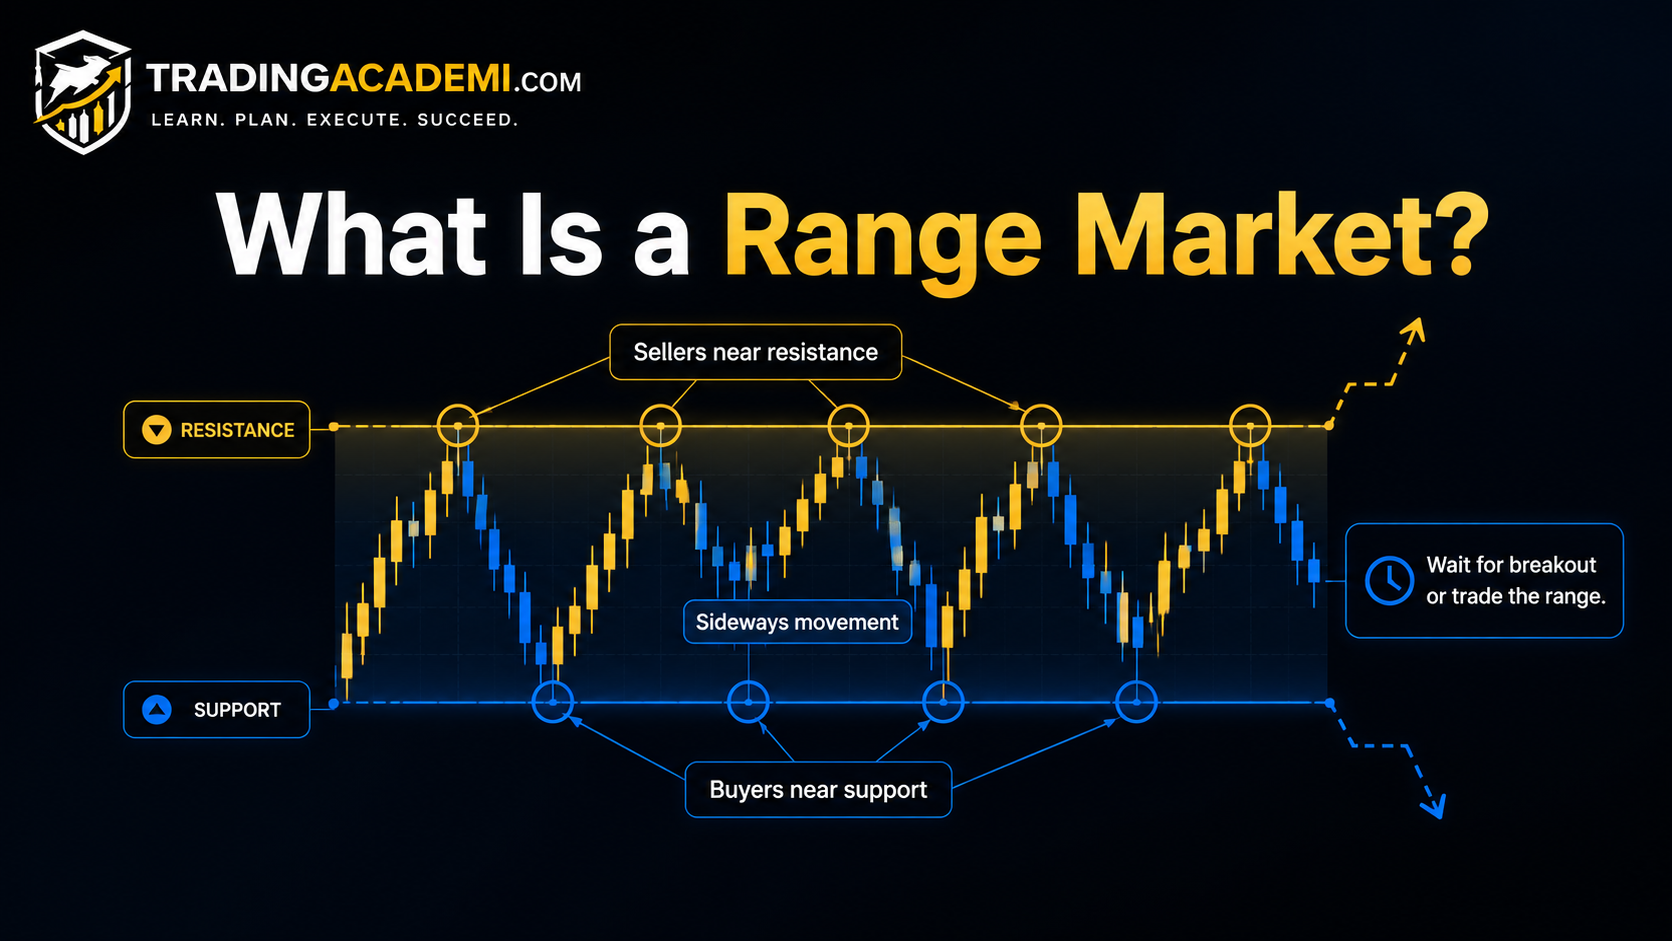
A range market happens when price moves sideways between support and resistance.
Instead of making clear higher highs or lower lows, price stays trapped between a lower zone and an upper zone. Buyers often appear near support, and sellers often appear near resistance.
Ranges are common because markets spend a lot of time consolidating. Price may range before a breakout, after a strong move, or during periods of uncertainty.
Range traders may look to buy near support and sell near resistance. Breakout traders may wait for price to escape the range before entering. Both approaches can work, but they require different plans.
The danger of range trading is that the range can break. A trader who buys support without a stop loss may be in trouble if price breaks below. A trader who sells resistance without a plan may be in trouble if price breaks above.
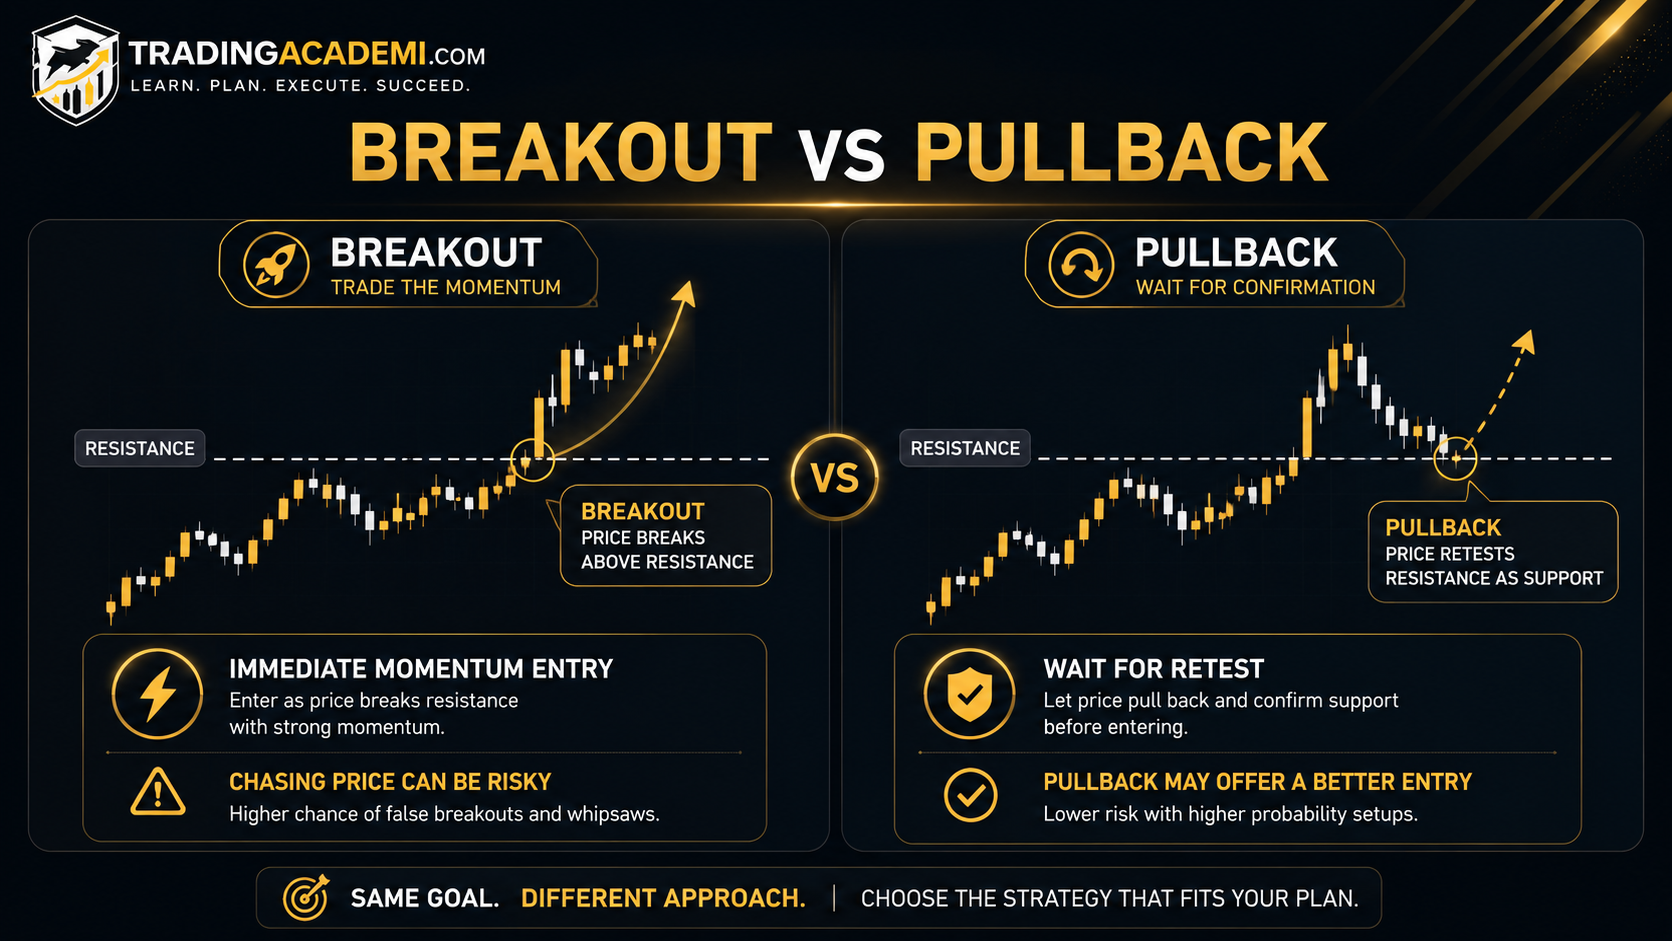
Breakout vs Pullback
Breakouts and pullbacks are different, but they often work together.
A breakout is the first move beyond an important level. A pullback is the retest or temporary move after the breakout.
For example, price may break above resistance. Some traders buy the breakout immediately. Other traders wait for price to pull back to the old resistance zone. If that level now acts as support, they may enter after the pullback.
Buying the breakout can help traders enter early, but it can also expose them to false breakouts. Waiting for a pullback can give a cleaner entry, but the market may continue without returning to the level.
There is no perfect method. The best choice depends on the trader’s strategy, risk tolerance, market speed, volume, and confirmation.
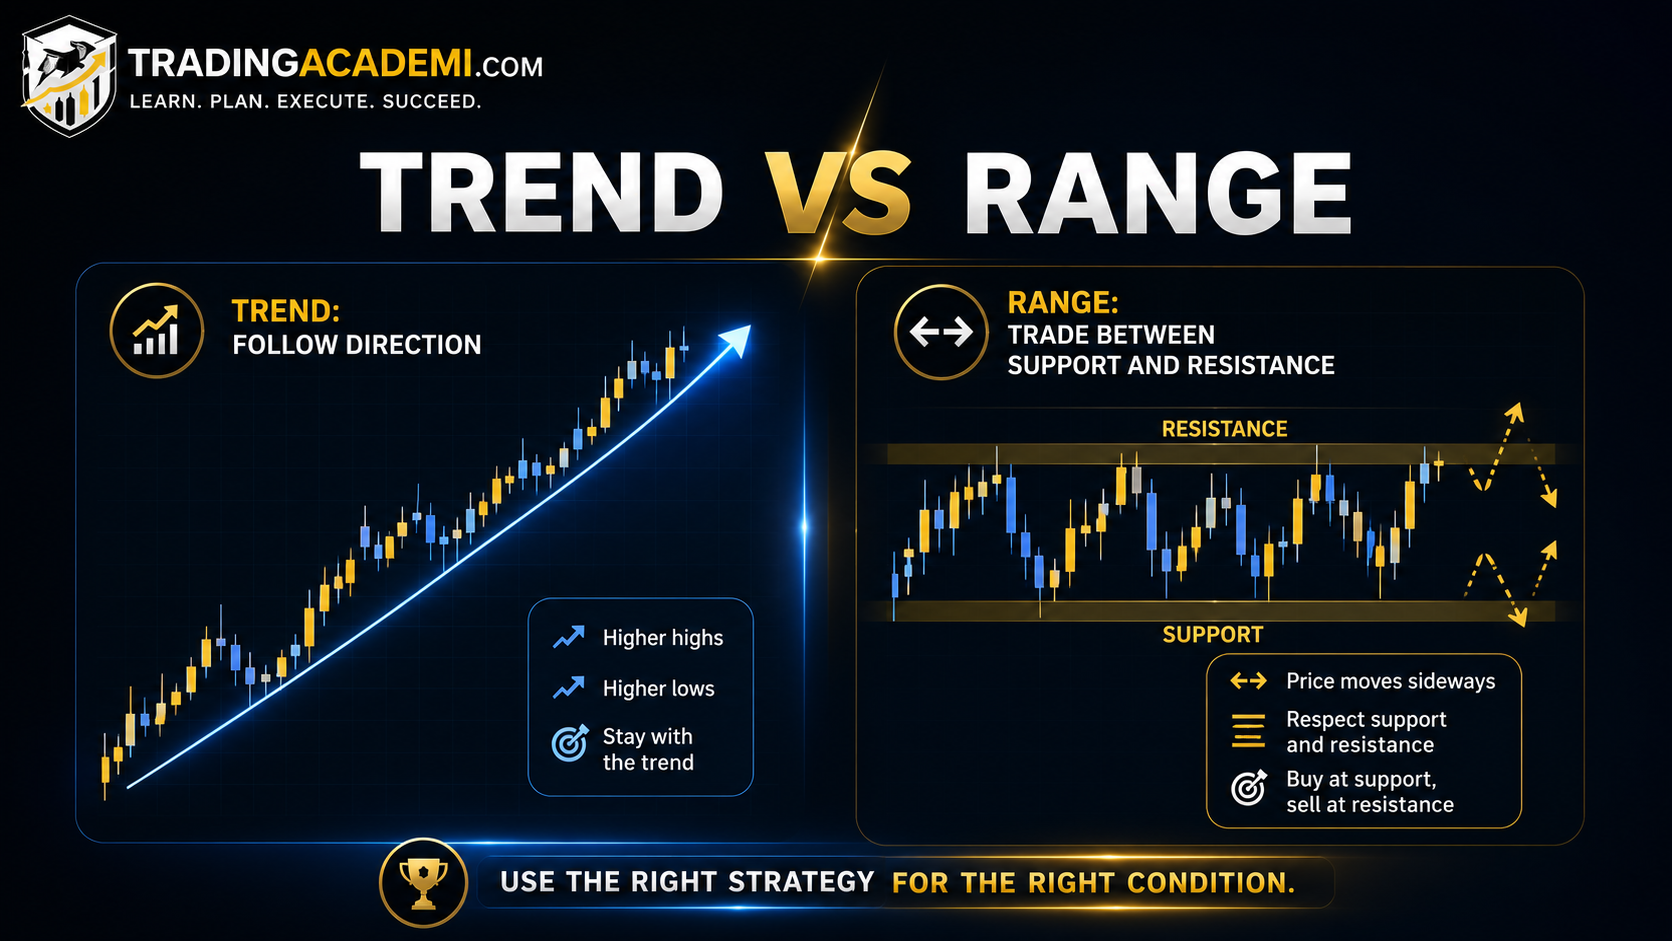
Trend vs Range
Trend and range are two different market conditions.
In a trend, price moves mostly in one direction. In a range, price moves sideways between support and resistance.
A trend trader tries to follow momentum. In an uptrend, they may look to buy pullbacks. In a downtrend, they may look to sell pullbacks. A range trader thinks differently. They may look to buy near support and sell near resistance until the range breaks.
The mistake beginners make is using the wrong strategy in the wrong condition. They may try to buy every support in a strong downtrend, or they may chase breakouts inside a messy range.
Before entering a trade, it helps to ask: is the market trending or ranging?
That simple question can prevent many bad trades.
How These Concepts Work Together
Breakouts, pullbacks, trends, and ranges are not separate ideas. They often appear together in real market movement.
A market may start in a range. Price moves between support and resistance for a while. Then price breaks above resistance. That breakout may start a new uptrend. After the breakout, price may pull back to retest the old resistance as new support. If the retest holds, the trend may continue.
This sequence is common:
Range → Breakout → Pullback → Trend ContinuationThe opposite can also happen:
Range → Breakdown → Pullback → Downtrend ContinuationUnderstanding this flow helps traders read charts with more structure. Instead of reacting emotionally to every candle, they can ask where price is in the larger movement.
How Traders Use Breakouts, Pullbacks, Trends, and Ranges
Traders use these concepts to build structured trade plans.
A breakout trader may look for price to close above resistance or below support, then enter in the breakout direction. A pullback trader may wait for price to return to a key level after a breakout or during a trend. A trend trader may identify the main direction and look for trades that follow it. A range trader may trade between support and resistance while the range remains valid.
These concepts also help traders plan stop losses and targets. For example, in a bullish breakout, a trader may place a stop loss below the breakout zone and target the next resistance level. In an uptrend pullback, a trader may place a stop loss below the recent higher low. In a range, a trader may target the opposite side of the range.
The goal is not to predict perfectly. The goal is to understand the market condition and choose a plan that fits it.
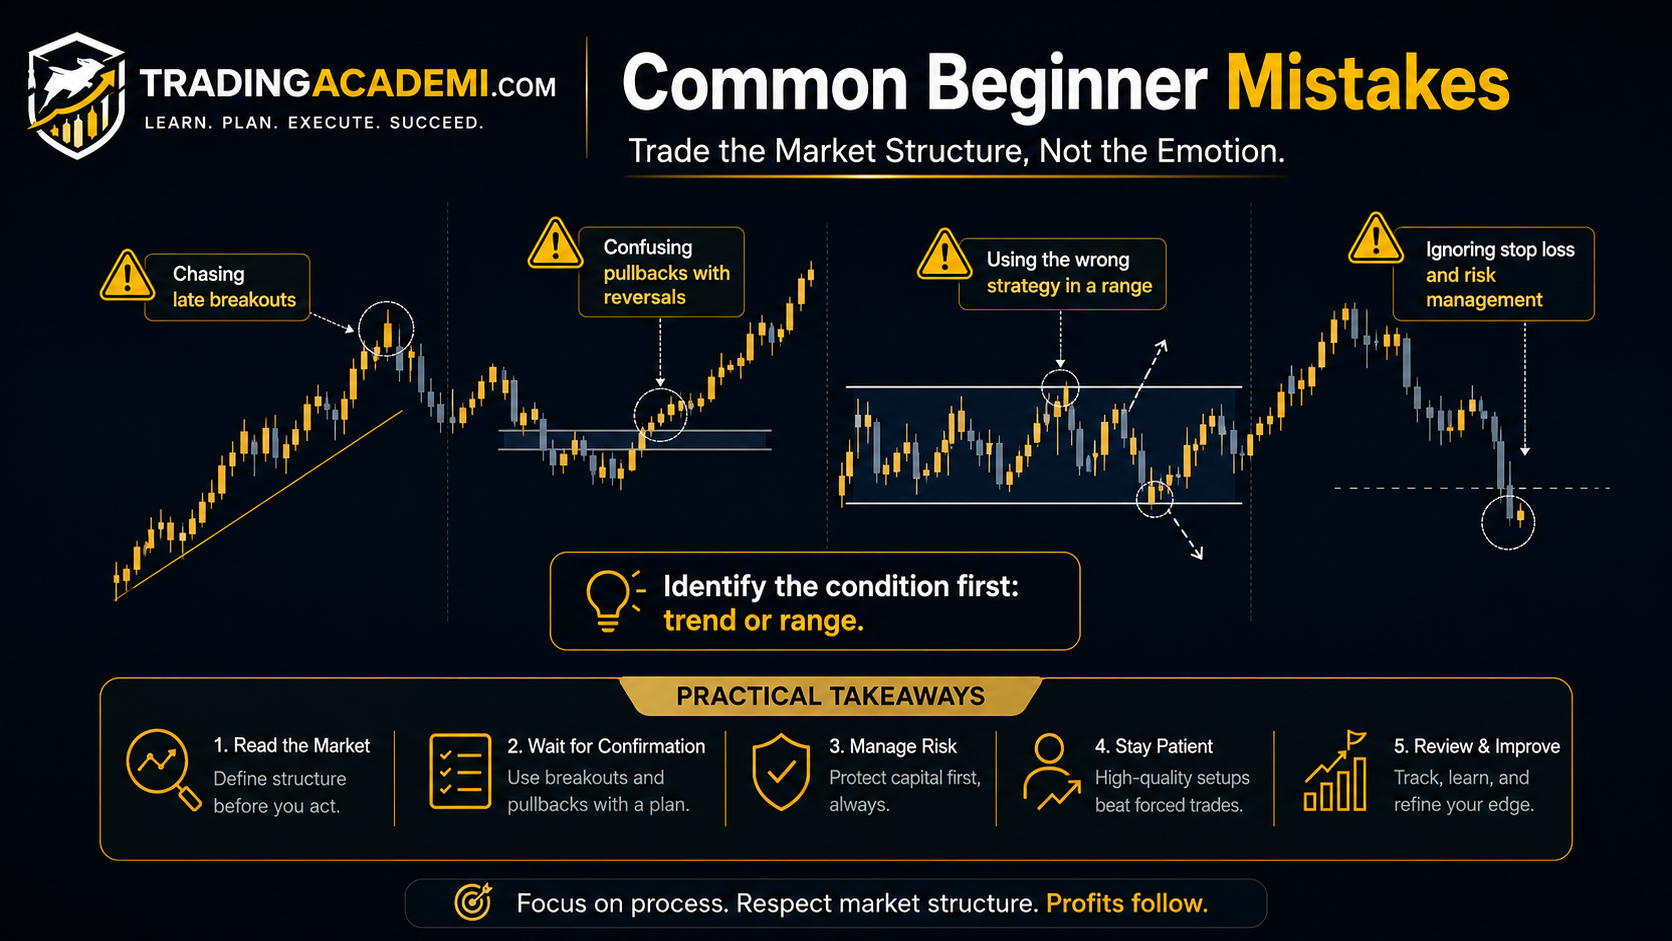
Common Beginner Mistakes
One common mistake is chasing breakouts too late. Beginners often see price move strongly and enter after the move is already extended. This can lead to poor entries and emotional exits if price pulls back.
Another mistake is confusing a pullback with a reversal. A small move against the trend does not always mean the trend is over. Beginners may exit too early or trade against the main direction without enough confirmation.
Many traders also fail to identify whether the market is trending or ranging. They use trend strategies in ranges and range strategies in trends. This creates confusion and inconsistent results.
A final mistake is forgetting risk management. No pattern is guaranteed. Breakouts fail, pullbacks can continue against you, trends can reverse, and ranges can break. Every trade needs a stop loss, position size, and clear invalidation point.
Beginner Checklist
Before trading a breakout, pullback, trend, or range, ask yourself a few simple questions.
Is the market trending or ranging? Is price near support or resistance? Is this a real breakout or just a temporary spike? If I am waiting for a pullback, where should price retest? Is there volume confirmation? Am I chasing price after a large move? Where is my stop loss if the setup fails? Where is my target if the trade works?
These questions help you slow down and trade with more structure.
The best traders do not react to every movement. They wait for the market to show a clear context, then they choose a setup that matches their plan.
Final Thoughts
Breakouts, pullbacks, trends, and ranges are core concepts in trading because they explain how price behaves on charts.
A breakout shows price moving beyond an important level. A pullback shows a temporary move against the current direction. A trend shows price moving mostly in one direction. A range shows price moving sideways between support and resistance.
Once you understand these ideas, market structure becomes easier to read. You can recognize when price is building momentum, when it is retesting a level, when buyers or sellers are in control, and when the market is simply moving sideways.
These concepts are not signals by themselves. They work best when combined with support and resistance, volume, liquidity, order execution, and risk management.
Trading becomes clearer when you stop asking only “Will price go up or down?” and start asking “What type of market structure am I trading?”
Educational Disclaimer
This article is for educational purposes only and should not be considered financial advice. Trading and investing involve risk, including the possible loss of capital. Breakouts, pullbacks, trends, and ranges can fail or change quickly depending on market conditions. Always do your own research and consider consulting a qualified financial professional before making financial decisions.