 By Anzo Trader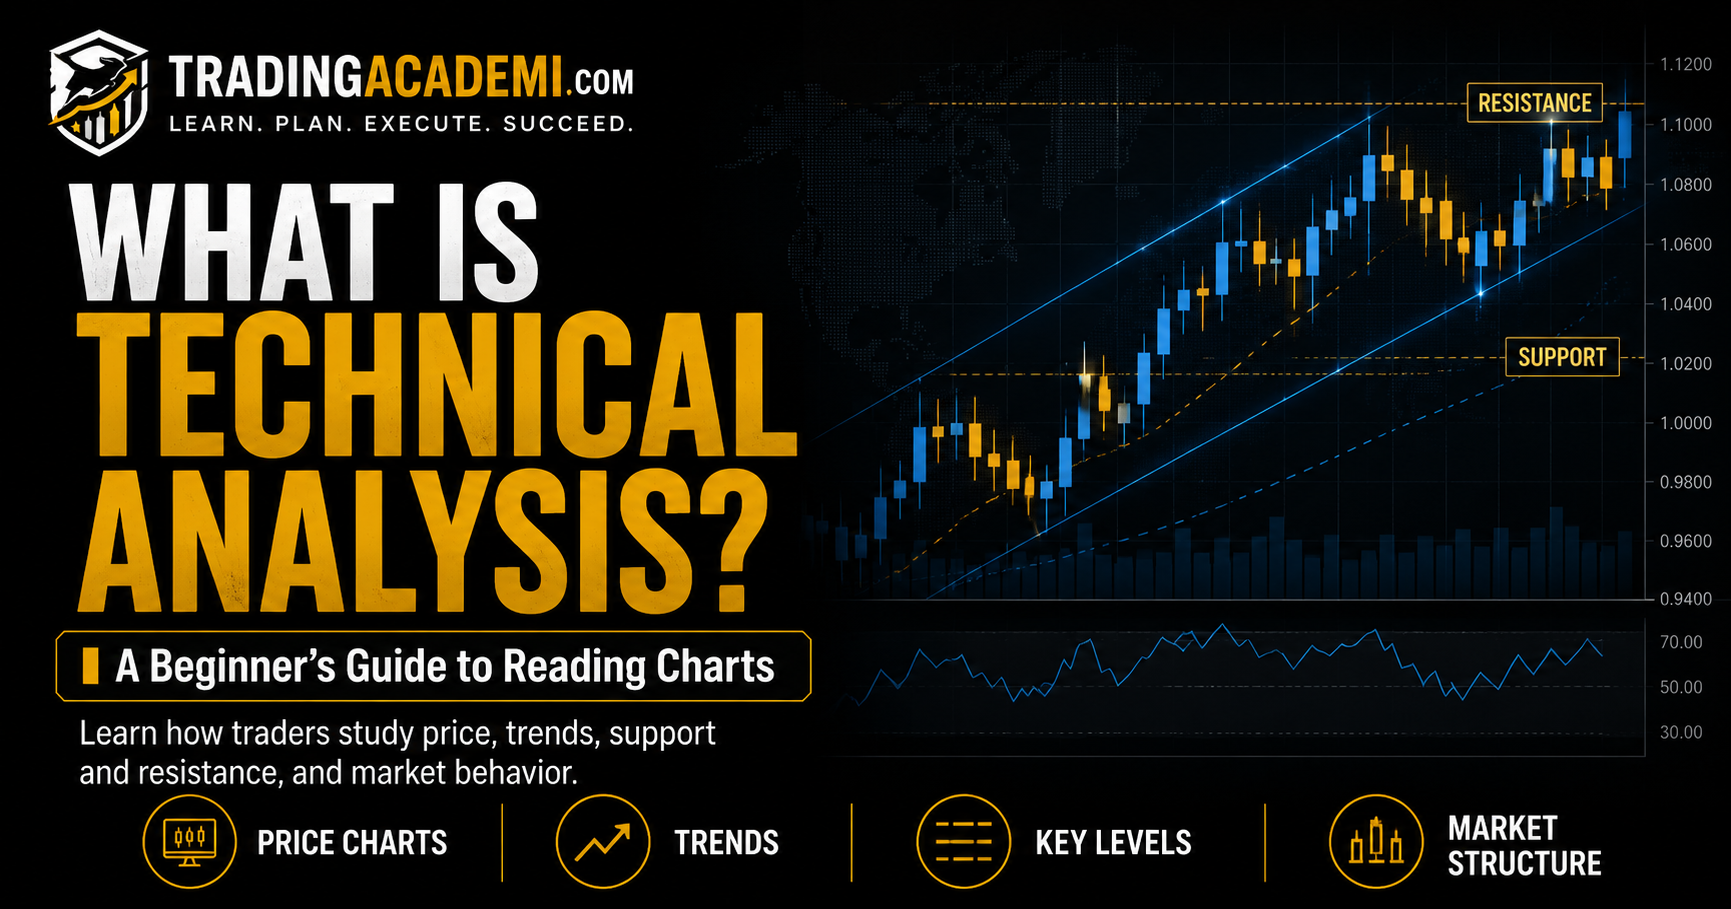
Technical analysis is one of the most common methods traders use to study financial markets. When beginners first open a trading chart, they often see candles, lines, indicators, volume bars, and price movement that may look confusing. Technical analysis helps organize all of that information into something traders can understand and use.
In simple terms, technical analysis means studying price charts to understand how the market has moved in the past and how it may move in the future.
A technical trader does not only ask what an asset is worth. Instead, they ask what price is doing right now, where buyers and sellers may be active, whether the market is trending or ranging, and where a trade idea may become invalid.
Technical analysis is used in many markets, including stocks, forex, futures, commodities, crypto, and indices. It can be used by day traders, swing traders, long-term investors, and active market participants.
However, technical analysis is not magic. It does not predict the future with certainty. It is a tool for reading market behavior, planning trades, managing risk, and making more structured decisions.
Before using advanced strategies, beginners should first understand the basics of charts, price action, trends, support and resistance, volume, and risk management.
What Is Technical Analysis?
Technical analysis is the study of market price movement using charts and trading tools.
The main idea is that price reflects the behavior of buyers and sellers. When buyers are stronger, price may rise. When sellers are stronger, price may fall. When neither side has clear control, price may move sideways.
Technical analysts use charts to study this behavior. They look at previous price levels, trend direction, candle movement, volume, and repeated patterns.
For example, if price has bounced from the same area several times, a trader may see that area as support. If price has failed to move above a level many times, a trader may see that area as resistance.
The goal is not to know the future perfectly. The goal is to understand the current market structure and build a plan around it.
Why Traders Use Technical Analysis
Traders use technical analysis because markets move through patterns of behavior. Price often reacts around important levels because traders, investors, institutions, and algorithms are watching similar areas.
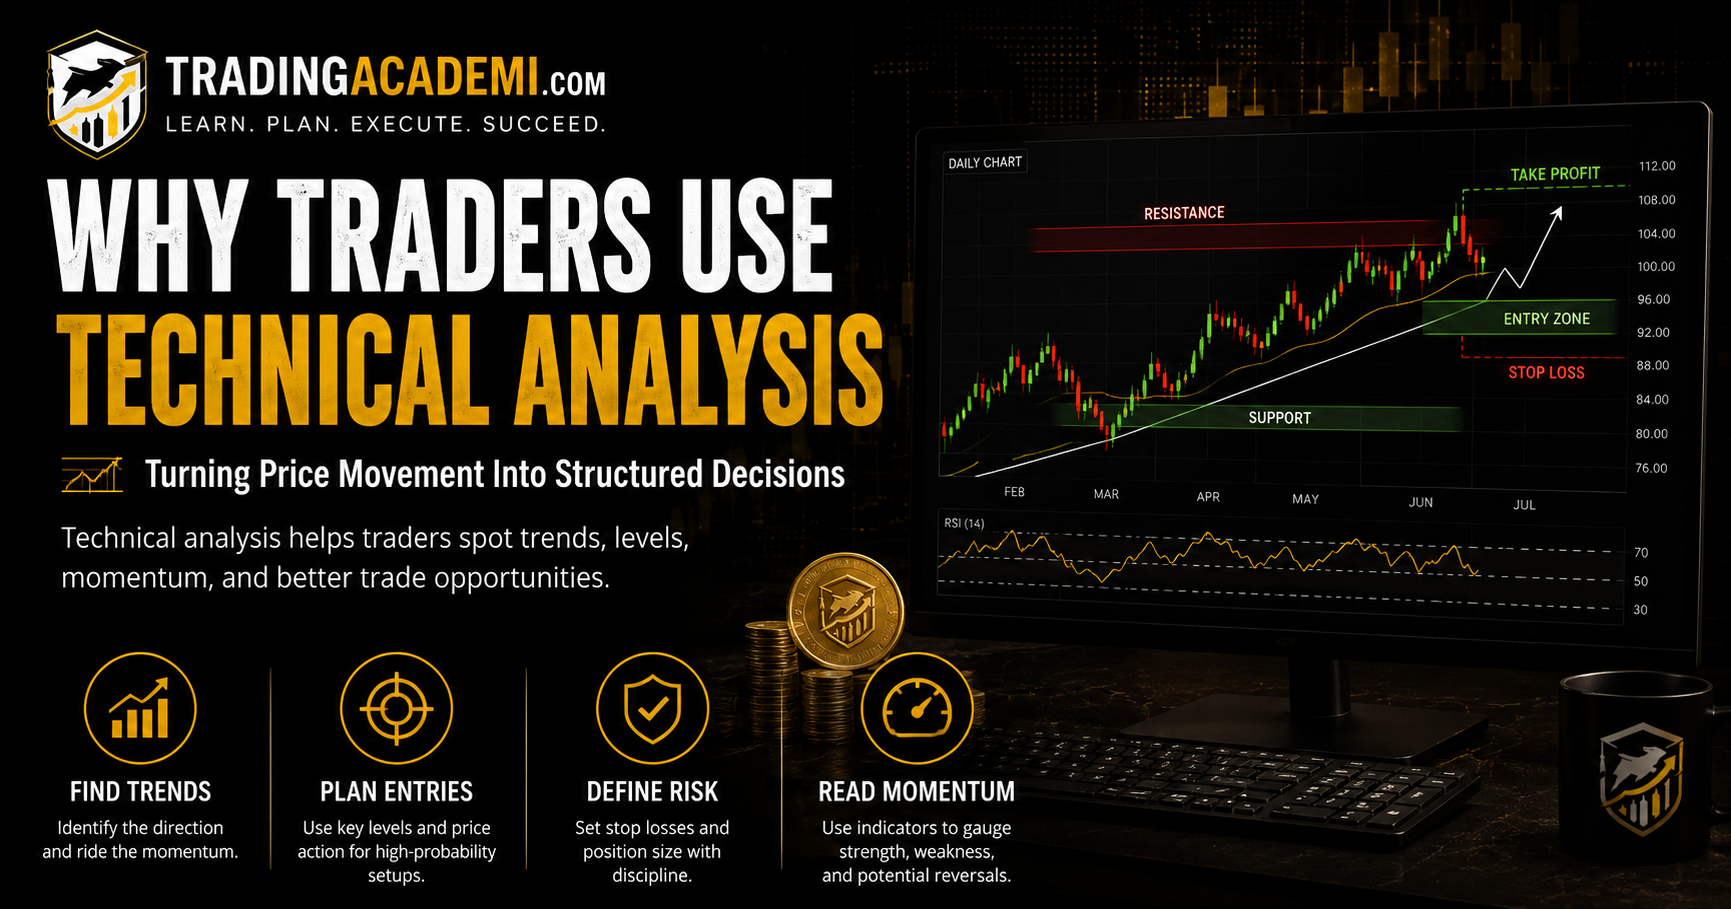
Technical analysis helps traders identify where price has reacted before, where momentum may be increasing, where a trend may be developing, and where risk can be defined.
For example, a trader may use technical analysis to decide where to enter a trade, where to place a stop loss, where to take profit, and whether the risk-to-reward ratio makes sense.
Without technical analysis, many traders may enter randomly because the market “looks like it is moving.” With technical analysis, the trader has more structure.
That structure does not guarantee success, but it helps reduce emotional decisions.

Technical Analysis vs Fundamental Analysis
Technical analysis focuses mainly on price charts, market structure, volume, trends, and trading patterns.
Fundamental analysis focuses more on value, economic data, company earnings, interest rates, inflation, financial statements, and macroeconomic conditions.
For example, a stock trader using fundamental analysis may study company revenue, profit, debt, management, and future growth. A technical trader may study the stock chart, trend direction, support and resistance, volume, and breakout levels.
Both methods can be useful. Some traders use only technical analysis. Others use only fundamentals. Many traders combine both.
A simple way to understand the difference is this: fundamental analysis asks why the market may move, while technical analysis studies how the market is moving.
The Basic Idea Behind Technical Analysis
The basic idea behind technical analysis is that price movement is not completely random. Markets are influenced by human behavior, fear, greed, supply, demand, liquidity, and expectations.
Because traders react to price levels, trends, and news, certain behaviors can repeat over time.
For example, price may rise strongly, then pull back, then continue higher. Price may break above resistance and attract more buyers. Price may fail at a level several times and create a range. Price may move quickly during high-volume sessions and slow down during low-volume periods.
Technical analysis tries to read these behaviors on the chart.
This does not mean every pattern will work. A breakout can fail. A trend can reverse. A support level can break. That is why technical analysis should always be combined with risk management.
Price Charts in Technical Analysis
A price chart shows how an asset’s price changes over time. It is the main tool used in technical analysis.
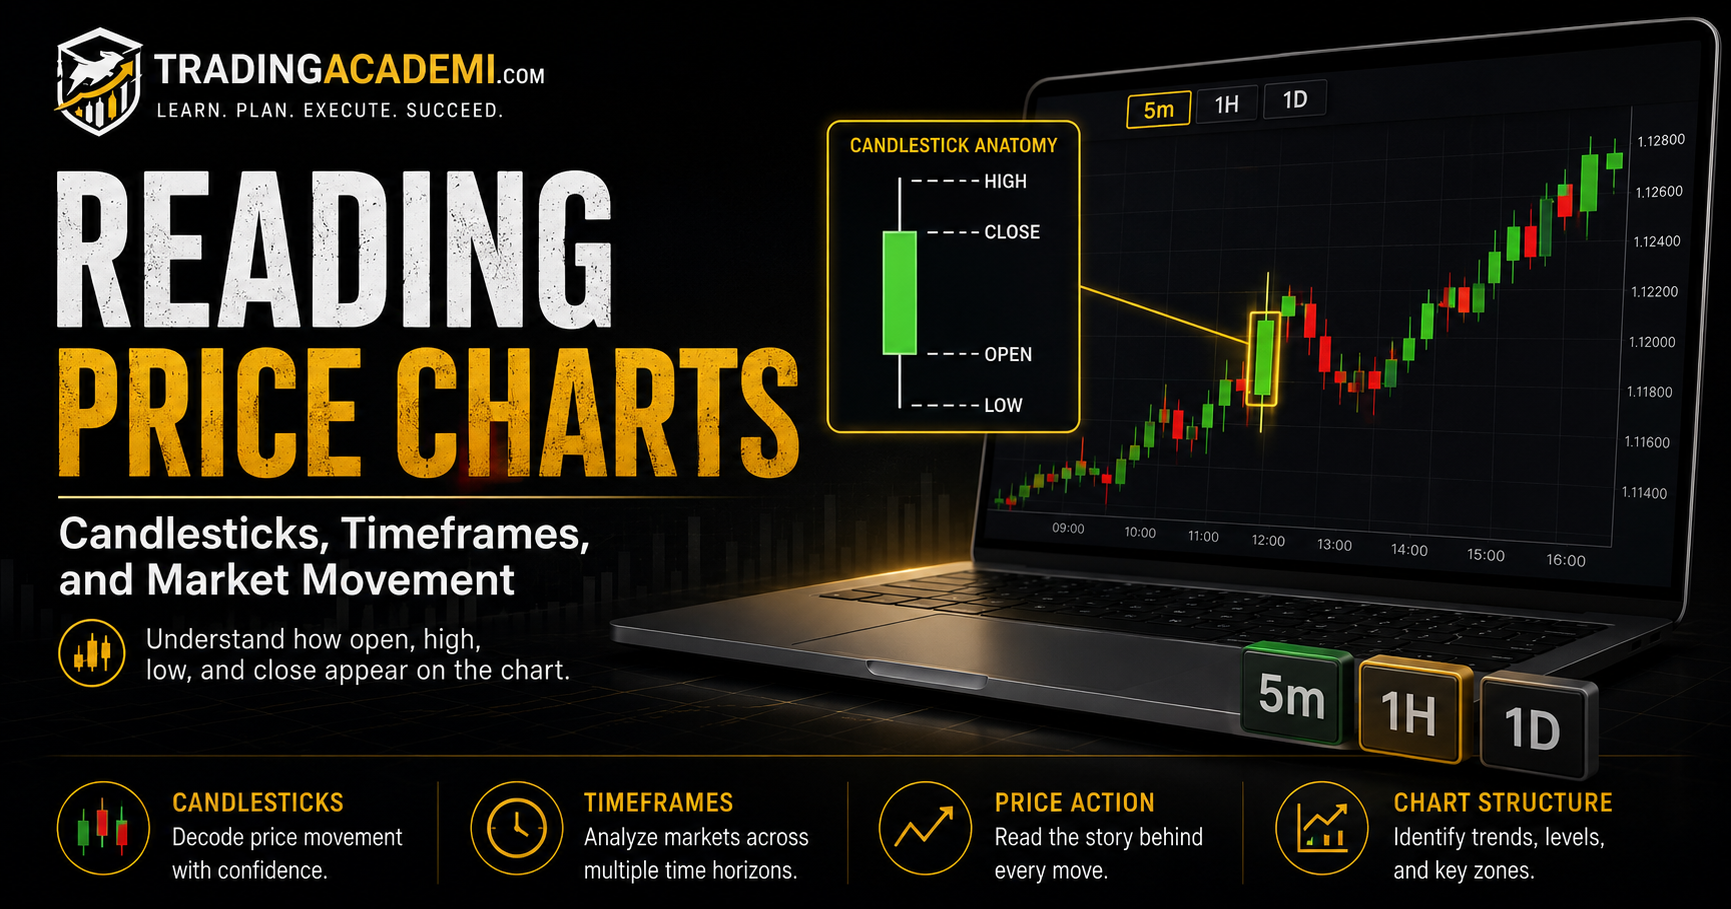
Charts can be displayed in different ways, such as line charts, bar charts, or candlestick charts. Most traders use candlestick charts because they show more information in a visual way.
A candlestick can show the open price, high price, low price, and close price for a specific period. This helps traders understand how price moved during that candle.
For example, a daily candle shows price movement during one day. A 1-hour candle shows price movement during one hour. A 5-minute candle shows price movement during five minutes.
The timeframe changes how much detail you see. Short timeframes show more noise, while higher timeframes often show bigger market structure.

Trends in Technical Analysis
A trend shows the general direction of the market.
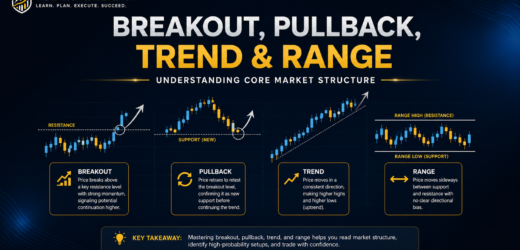
An uptrend happens when price is generally moving higher. Traders often identify it through higher highs and higher lows. This means buyers are repeatedly pushing price upward.
A downtrend happens when price is generally moving lower. Traders often identify it through lower highs and lower lows. This means sellers are repeatedly pushing price downward.
A sideways market, also called a range, happens when price moves between support and resistance without a clear direction.
Trends are important because many traders prefer to trade in the direction of the main market movement. Buying in an uptrend or selling in a downtrend can sometimes be easier than fighting the direction of price.
However, trends do not last forever. That is why traders also watch for weakness, reversals, and changes in market structure.

Support and Resistance
Support and resistance are two of the most important concepts in technical analysis.
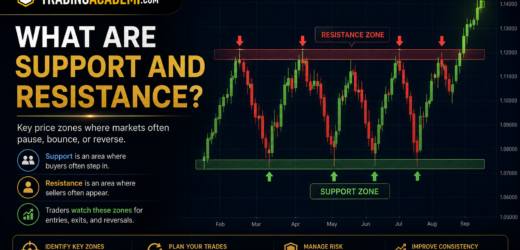
Support is an area where price may stop falling because buyers become active. Resistance is an area where price may stop rising because sellers become active.
For example, if a stock falls to $50 several times and bounces from that level, traders may see $50 as support. If the same stock rises to $60 several times and fails to move higher, traders may see $60 as resistance.
Support and resistance are useful because they help traders plan entries, exits, stop losses, and targets.
They are not perfect levels. Price can break through them, fake out traders, or move slightly beyond them before reversing. That is why many traders treat support and resistance as zones instead of exact lines.

Price Action
Price action means reading the movement of price itself without depending too much on indicators.
A price action trader may look at candle shapes, swing highs, swing lows, pullbacks, breakouts, ranges, and trend structure.
For example, if price breaks above resistance with strong momentum, a trader may see that as a sign of buyer strength. If price pulls back to a previous breakout level and holds, the trader may see that as a possible continuation setup.
Price action is popular because it helps traders focus directly on what the market is doing.
However, price action still requires discipline. A chart can always be interpreted in different ways, so traders need clear rules instead of guessing.

Technical Indicators
Technical indicators are tools that use price, volume, or mathematical formulas to help traders analyze the market.
Common indicators include moving averages, RSI, MACD, Bollinger Bands, stochastic oscillator, and volume-based tools.
A moving average can help show the general direction of price. RSI can help identify momentum and possible overbought or oversold conditions. MACD can help show changes in momentum. Volume indicators can help measure participation.
Indicators can be useful, but beginners should be careful not to use too many at the same time. Adding more indicators does not always create better analysis. Sometimes it creates confusion.
Indicators should support your analysis, not replace your thinking.
Volume in Technical Analysis
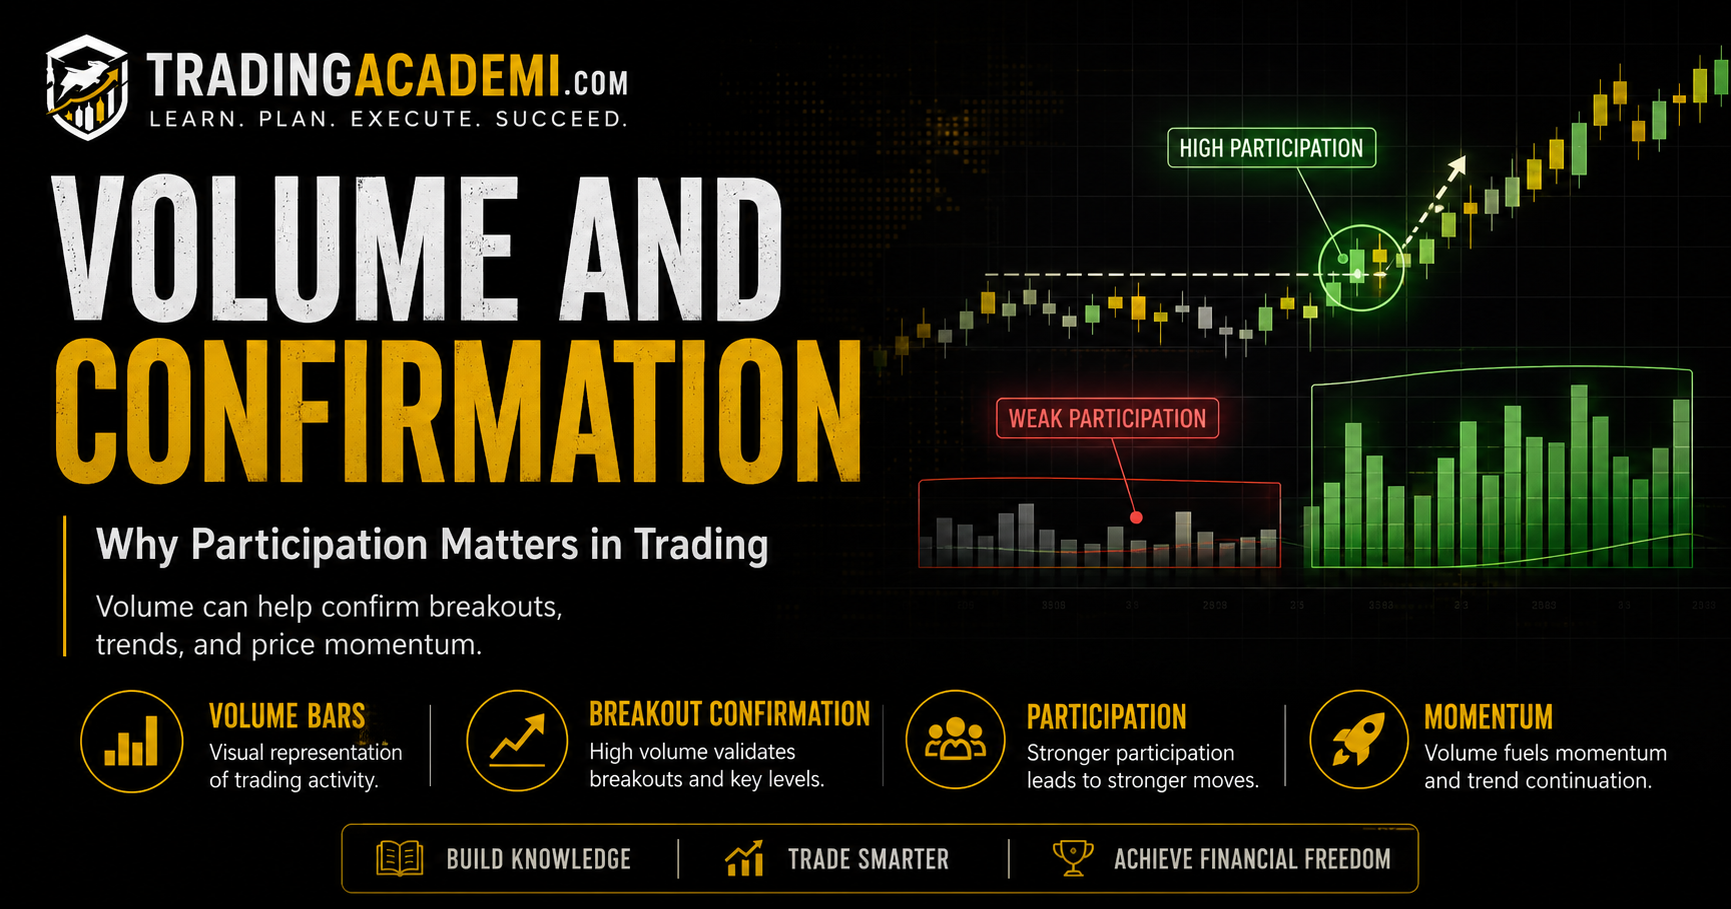
Volume shows how much trading activity happened during a specific period. It helps traders understand participation.
For example, if price breaks above resistance with high volume, some traders may see the move as stronger because more participants were involved. If price breaks above resistance with very low volume, the breakout may look weaker.
Volume can also help traders identify strong moves, weak moves, exhaustion, and possible confirmation.
In some markets, such as stocks and futures, volume can be very useful. In other markets, such as spot forex, volume data may depend on the broker or platform.
Volume should not be used alone, but it can add important context to price action.
Chart Patterns
Chart patterns are shapes that appear when price moves in a certain structure over time.
Common chart patterns include triangles, flags, wedges, double tops, double bottoms, head and shoulders, and rectangles.
Traders use chart patterns to understand market compression, continuation, reversal, or breakout potential.
For example, a triangle may show that price is compressing before a possible breakout. A double top may suggest that buyers are struggling to push price higher. A flag may appear after a strong trend move and suggest a possible continuation.
Chart patterns can be helpful, but they are not guaranteed. Beginners should avoid forcing patterns onto every chart. A pattern should be clear and supported by market context.

Technical Analysis and Risk Management
Technical analysis should always be connected with risk management.
A trader may use technical analysis to find a good setup, but risk management decides how much they can lose if the setup fails.
For example, support and resistance can help define stop loss placement. Trend structure can help decide whether a trade makes sense. Risk-to-reward can help decide whether the target is worth the risk. Position sizing can help control the total amount at risk.
A technical setup without risk management is incomplete.
Even if the analysis looks good, the market can still move against you. That is why every trade needs a stop loss, position size, and clear plan.
Technical Analysis in Different Markets
Technical analysis can be used in many markets, but each market has its own behavior.
In stocks, traders may use technical analysis to study trends, gaps, earnings reactions, support and resistance, and volume. In forex, traders may use it to analyze currency pairs, sessions, volatility, and key levels. In futures, traders may focus on price action, volume, market profile, and order flow. In crypto, technical analysis is common because markets move quickly and trade 24/7.
The core concepts are similar, but traders should understand the market they are trading.
A support level in a large-cap stock may behave differently from a support level in a low-liquidity crypto coin. A breakout in forex may behave differently during a major news release than during a quiet session.
Context matters.
Advantages of Technical Analysis
Technical analysis has several advantages. It gives traders a visual way to understand price movement and helps create structure around entries, exits, stop losses, and targets.
It can be used across different markets and timeframes. It can also help traders react faster because charts update continuously.
Another advantage is that technical analysis can help traders focus on what price is actually doing instead of only relying on opinions or predictions.
For beginners, technical analysis can make the market easier to organize. Instead of seeing random movement, the trader starts seeing trends, ranges, levels, breakouts, and pullbacks.
Limitations of Technical Analysis
Technical analysis also has limitations.
It does not predict the future with certainty. A clean setup can fail. A strong level can break. A good-looking pattern can become invalid.
Another limitation is that technical analysis can become subjective. Two traders may look at the same chart and see different things. One may see a breakout, while another may see a false move. One may draw support slightly differently than another.
Technical analysis can also create overconfidence if a trader believes the chart is always right. The chart can give clues, but it cannot remove uncertainty.
This is why technical analysis should be used with discipline, risk management, and a written trading plan.
Common Technical Analysis Mistakes Beginners Make
One common mistake is using too many indicators. Beginners sometimes believe that adding more tools will create better signals, but too many indicators can create confusion and conflicting information.
Another mistake is forcing patterns. A trader may want to see a triangle, reversal, or breakout even when the chart is not clear.
Many beginners also draw support and resistance randomly. If levels are not based on clear price reactions, they may not be useful.
Ignoring the higher timeframe is another common mistake. A trade may look good on a small timeframe but go against the larger trend.
Some traders also forget risk management. They may have a good technical idea but risk too much, place no stop loss, or enter without a target.
Technical analysis works best when it is simple, structured, and connected to risk.
How Beginners Should Start Learning Technical Analysis
Beginners should start with the basics before jumping into advanced tools.
The first step is learning how to read candlestick charts. After that, learn trends, support and resistance, breakouts, pullbacks, and range markets.
Once those concepts are clear, you can study price action, volume, moving averages, RSI, MACD, and chart patterns.
It is better to master a few tools than to use many tools without understanding them.
A simple beginner path could be:
1. Learn candlestick charts
2. Learn trends and ranges
3. Learn support and resistance
4. Learn breakouts and pullbacks
5. Learn basic indicators
6. Learn volume analysis
7. Learn risk management
8. Build a trading plan
9. Journal your trades
This step-by-step approach helps you build a foundation instead of jumping from one strategy to another.
Technical Analysis Checklist
Before using technical analysis to take a trade, ask yourself a few questions.
Is the market trending or ranging? Where are the important support and resistance zones? Is price near a key level or in the middle of nowhere? Is there a clear setup? Does the trade have a logical stop loss? Is the target realistic? Is the risk-to-reward acceptable? Does the trade match your plan?
You should also ask whether you are trading based on analysis or emotion.
If the chart is not clear, you do not need to force a trade. Sometimes the best decision is to wait.
Final Thoughts
Technical analysis is a powerful tool for understanding market movement. It helps traders read charts, identify trends, study support and resistance, use indicators, analyze volume, and plan trades with more structure.
But technical analysis is not a guarantee. It does not remove uncertainty, and it does not make every trade successful.
The real value of technical analysis is that it helps traders make more organized decisions. Instead of entering randomly, the trader can create a plan based on price behavior, market structure, and risk.
For beginners, the goal should not be to memorize every pattern or indicator. The goal should be to understand how price moves and how to manage risk when your analysis is wrong.
A good trader does not use technical analysis to avoid losses completely. A good trader uses technical analysis to plan better trades and manage risk more clearly.
Educational Disclaimer
This article is for educational purposes only and should not be considered financial advice. Trading and investing involve risk, including the possible loss of capital. Technical analysis does not guarantee profits or prevent losses. Always do your own research or consult a qualified financial professional before making financial decisions.