Most traders hear the name Commodity Channel Index and immediately assume it was designed only for commodities. That assumption causes many traders to overlook one of the most versatile momentum indicators available today. Despite its name, the CCI works effectively across futures, stocks, forex, indices, and cryptocurrencies. Whether you’re trading the ES500, NQ, crude oil, or major currency pairs, the Commodity Channel Index can provide valuable insight into momentum, trend strength, and potential shifts in market behavior.
Like many indicators, however, the CCI is often misunderstood. Beginners tend to use it as a simple buy and sell signal. They see the indicator rise above a certain level and immediately buy, or drop below a certain level and immediately sell. After a few losing trades, they conclude that the indicator doesn’t work. The problem is rarely the indicator itself. The problem is how traders use it.
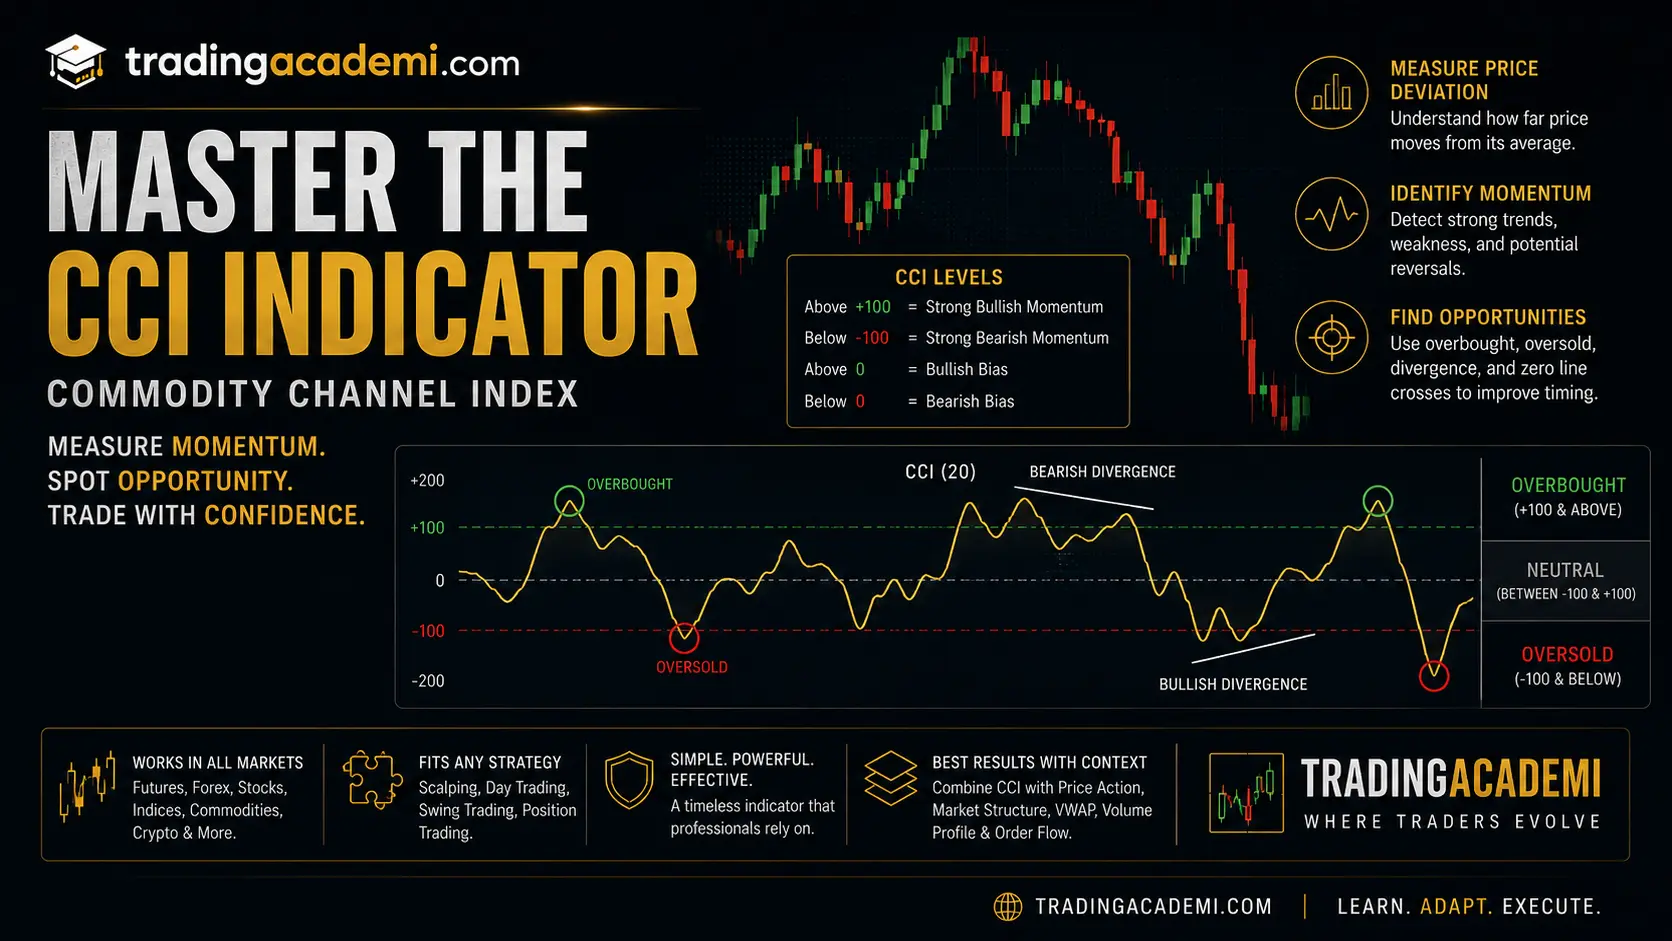
The Commodity Channel Index was developed by Donald Lambert and was originally designed to identify cyclical trends in commodities. Over time, traders discovered that its ability to measure price deviations from a statistical average made it useful in virtually every financial market. Rather than focusing solely on price direction, the CCI measures how far price has moved away from its average value over a selected period.
This concept aligns surprisingly well with Auction Market Theory.
Markets constantly move between balance and imbalance. They rotate around fair value before expanding toward new areas of price discovery. The CCI helps traders identify when price is moving unusually far away from its average, potentially signaling strong momentum, trend continuation, or an overextended market condition.
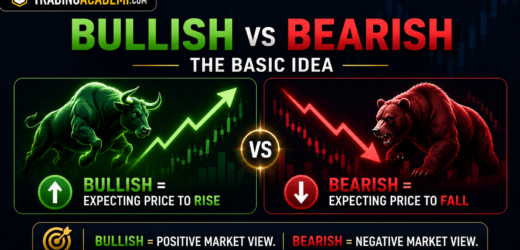
One of the biggest misconceptions surrounding the CCI is that readings above +100 automatically mean the market is overbought and readings below -100 automatically mean the market is oversold. In reality, these levels often indicate strong momentum rather than immediate reversal opportunities.
When the CCI rises above +100, it suggests that buyers are aggressively pushing price away from its average value. This often occurs during strong bullish trends. Similarly, when the indicator falls below -100, it signals powerful bearish momentum as sellers drive price lower.
Professional traders understand that these readings are often signs of strength rather than reasons to enter against the trend.
This is where context becomes critical.
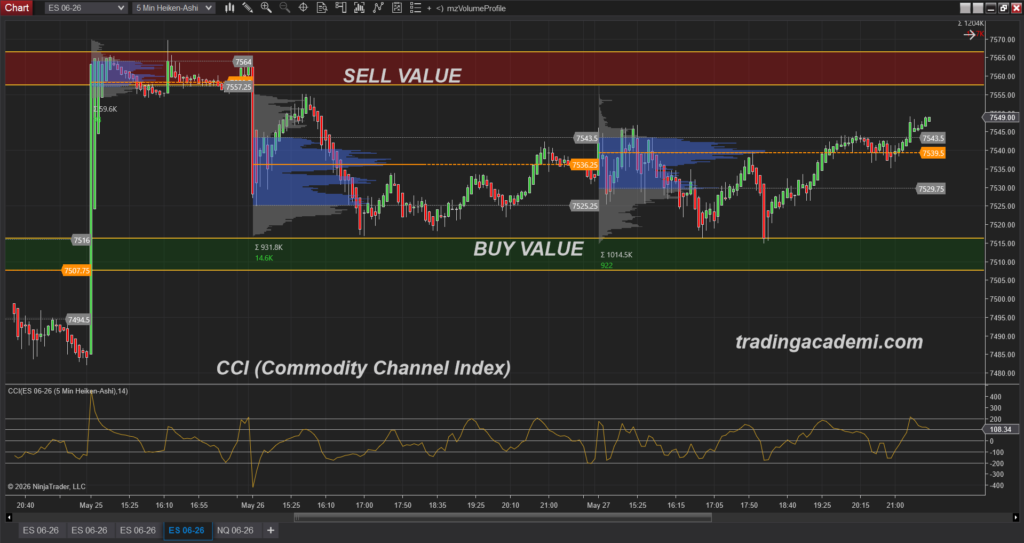
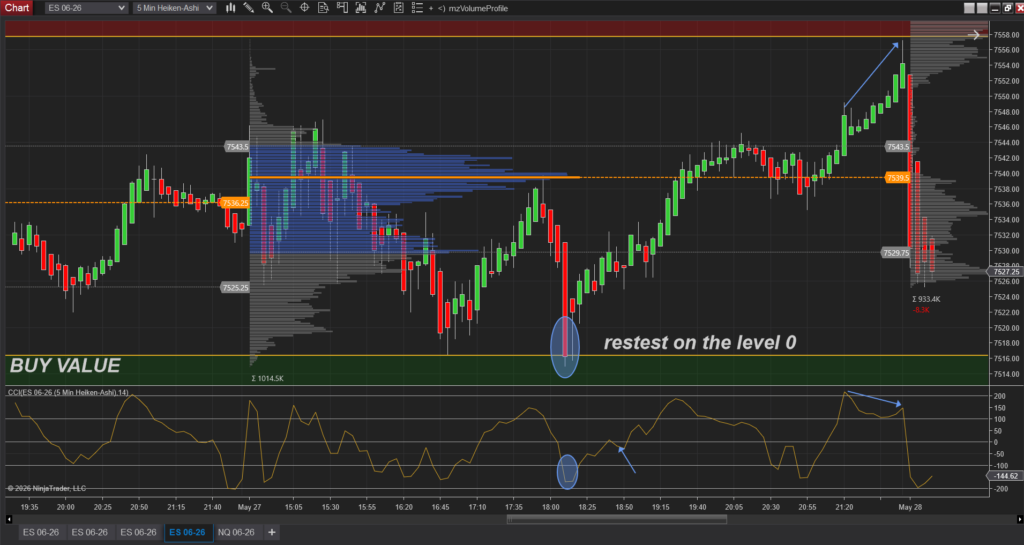
A CCI reading above +100 occurring during a bullish auction, above VWAP, and above value area has a completely different meaning than the same reading occurring directly into major resistance after an extended move. The indicator itself provides information, but context determines how that information should be interpreted.
This is one of the core principles we teach throughout TradingAcademi and inside The Daily $100 Project. Indicators should never be used in isolation. They should support your understanding of the market, not replace it.
One of the most powerful ways to use the Commodity Channel Index is trend confirmation. During strong bullish markets, traders often look for pullbacks where the CCI temporarily retreats before moving back above zero or above +100. This can signal that momentum is returning in the direction of the primary trend. During bearish markets, traders monitor similar behavior below zero to identify opportunities where selling pressure is re-entering the market.
Another popular application involves divergence analysis. Divergence occurs when price and momentum begin telling different stories. For example, if price creates a higher high while the CCI forms a lower high, momentum may be weakening even though price continues moving higher. Conversely, if price creates a lower low while the CCI forms a higher low, selling pressure may be losing strength beneath the surface.
Divergence should never be used as a standalone trading signal, but it can provide valuable clues that market conditions may be changing.
Many traders also use the zero line as a trend filter. When the CCI remains above zero, momentum generally favors buyers. When it remains below zero, momentum generally favors sellers. This simple approach can help traders avoid taking trades against the dominant market direction.
The standard setting for the Commodity Channel Index is 20 periods, which offers a balanced view of short-term and intermediate-term momentum. Shorter settings create faster signals but generate more noise, while longer settings produce smoother signals but may react more slowly to changing market conditions.
Like all indicators, the CCI has strengths and weaknesses. It performs exceptionally well during trending conditions where momentum plays an important role. During highly rotational or range-bound environments, however, it can generate multiple false signals as price oscillates around fair value. This is why combining the indicator with market structure, VWAP, Volume Profile, support and resistance, and Auction Market Theory significantly improves its effectiveness.
At TradingAcademi, we do not view the Commodity Channel Index as a magic tool that predicts the future. We view it as a momentum and context indicator that helps traders understand where price is relative to value and whether momentum is supporting the current move. Used correctly, the CCI becomes another powerful piece of information within a complete trading framework.
Because successful trading is never about finding one perfect indicator.
It is about understanding the auction, recognizing context, and using the right tools to help you interpret what the market is doing in real time.