Most traders discover the Stochastic Oscillator early in their trading journey. They learn that when the indicator reaches the overbought zone above 80, the market is supposedly ready to fall. When it reaches the oversold zone below 20, the market is supposedly ready to rise. The problem is that after a few weeks of trading, they quickly realize that the market does not always behave that way.
Price can remain overbought for hours, days, or even weeks during a strong trend. Likewise, price can remain oversold while continuing to move lower. This often creates frustration for beginners who start questioning whether the indicator works at all.
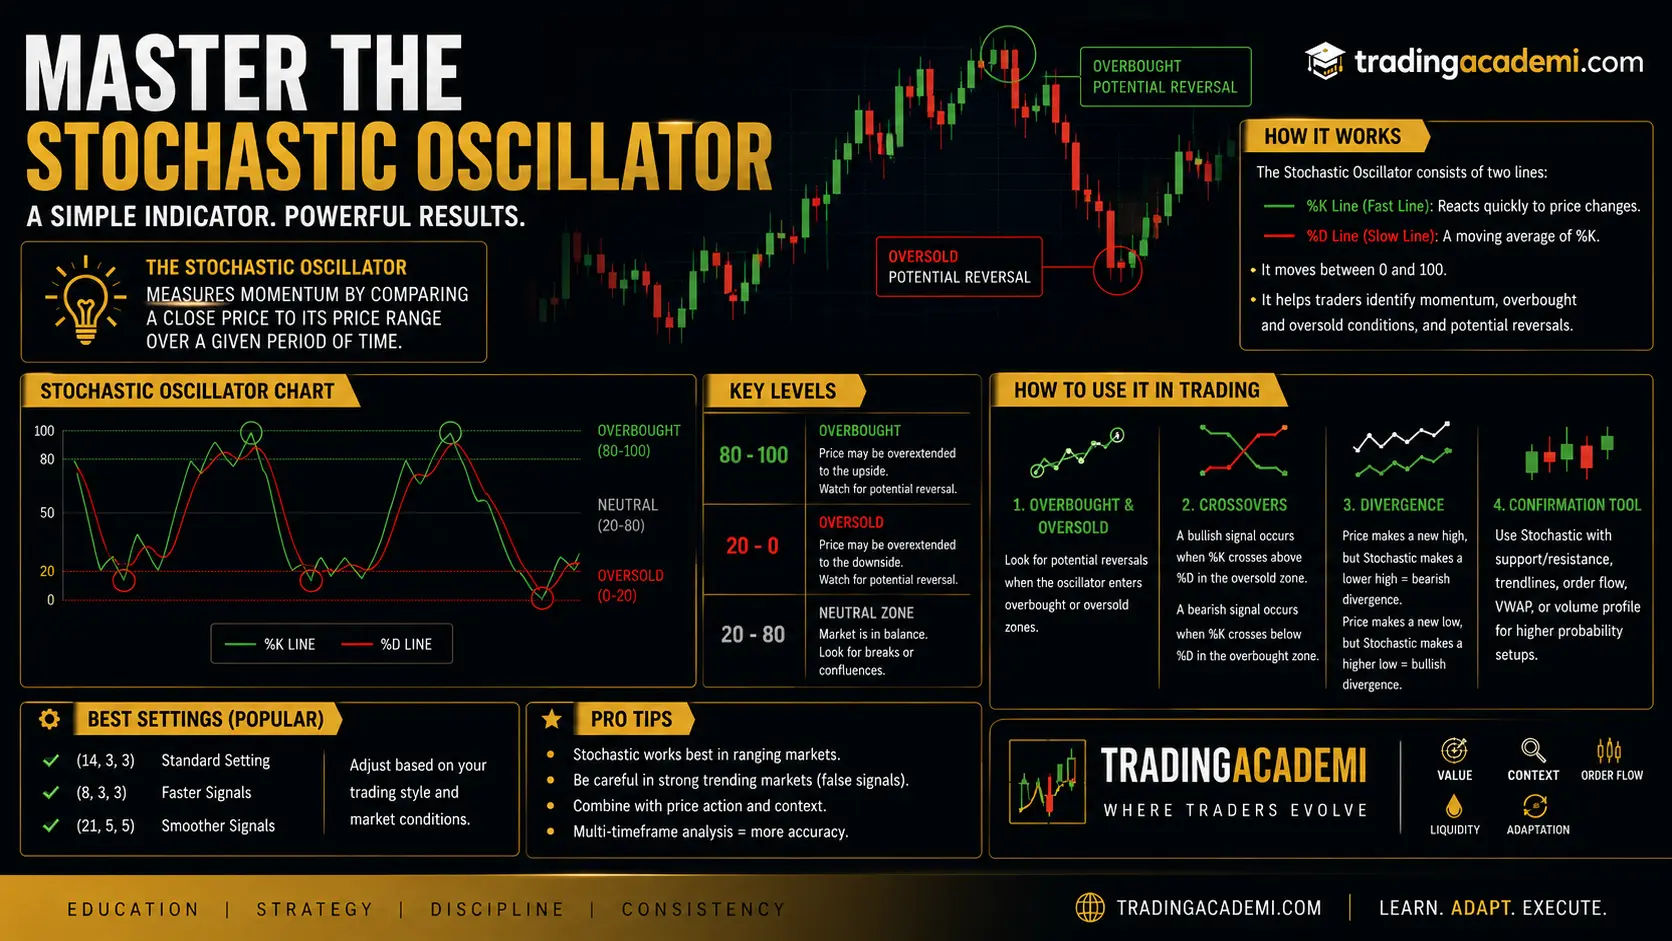
The reality is that the Stochastic Oscillator was never designed to predict reversals by itself. It was designed to measure momentum. Understanding this distinction changes everything.
The Stochastic Oscillator compares the current closing price to the recent trading range. Instead of focusing on where price is, it focuses on how strongly price is moving relative to recent market activity. This makes it one of the most effective momentum indicators available to traders when used correctly.
One of the biggest mistakes traders make is using Stochastic as a standalone trading system. Professional traders rarely make decisions based on a single indicator. Instead, they use indicators as tools that help them understand what is happening beneath the surface of price action.
This is where context becomes important.
Inside a strong uptrend, an overbought reading is often a sign of strength rather than weakness. Buyers continue accepting higher prices and momentum remains positive. Selling simply because the indicator moved above 80 can lead to repeated losses. Likewise, during a strong downtrend, oversold conditions often reflect aggressive selling pressure rather than an immediate buying opportunity.
The best traders understand that indicators must always be interpreted within the context of the market environment.
This idea aligns perfectly with Auction Market Theory. Markets constantly move through phases of balance and imbalance as buyers and sellers negotiate value. The Stochastic Oscillator can help traders identify changes in momentum during these phases, but it should never replace an understanding of the auction itself.
If you have not yet read our complete guide on Auction Market Theory, you can find it here:
When used properly, the Stochastic Oscillator becomes a timing tool rather than a prediction tool. Instead of asking whether the market is overbought or oversold, professional traders ask different questions. Is momentum accelerating or slowing? Is price confirming the trend? Is momentum diverging from price action? Is the current move supported by participation or showing signs of exhaustion?
These questions provide significantly more information than simply reacting to indicator levels.
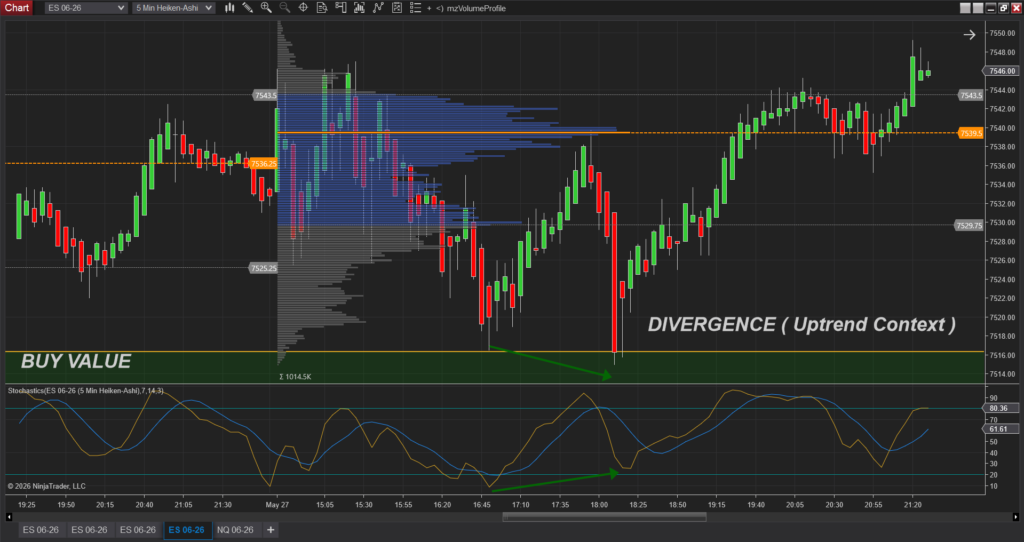
One of the most powerful concepts involving the Stochastic Oscillator is divergence. Divergence occurs when price and momentum begin telling different stories. For example, if price creates a new high while the Stochastic Oscillator creates a lower high, momentum may be weakening beneath the surface. Similarly, if price makes a new low while the indicator forms a higher low, selling pressure may be losing strength.
Divergence does not guarantee a reversal, but it often serves as an early warning that market conditions may be changing.
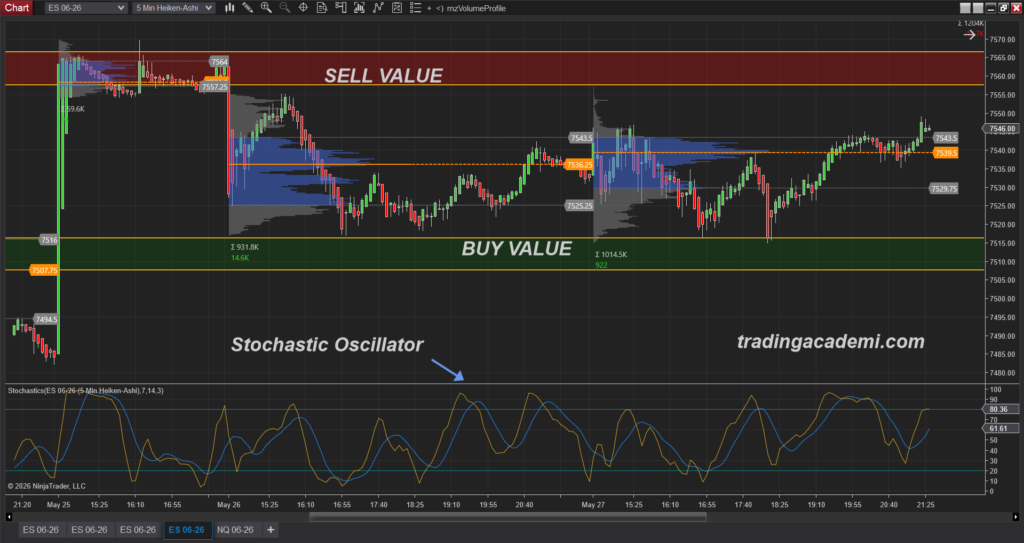
Another popular use of the indicator involves the crossover between the %K and %D lines. When the faster %K line crosses above the slower %D line, traders interpret it as a bullish momentum signal. When %K crosses below %D, traders interpret it as bearish momentum. However, these signals become much more reliable when they occur near important support and resistance zones, value areas, VWAP levels, or key liquidity locations.
This is why professional traders rarely separate indicators from market structure.
The most common Stochastic setting is (14,3,3), which provides a balanced view of momentum suitable for many market conditions. Short-term traders often prefer faster settings such as (8,3,3), while swing traders may choose slower configurations that reduce noise and focus on larger market movements.
No matter which setting you use, the goal remains the same: understand momentum, not predict the future.
The Stochastic Oscillator works best when combined with other forms of analysis. Many traders pair it with VWAP, Volume Profile, Market Structure, Support and Resistance, Order Flow, and Auction Market Theory. Together, these tools provide a more complete understanding of what the market is doing and why.
At TradingAcademi, we view the Stochastic Oscillator as one piece of a much larger puzzle. It helps us understand participation, momentum, and potential shifts in market behavior, but the final decision always comes back to context, value, and the auction taking place between buyers and sellers.
Because in the end, successful trading is not about finding a magical indicator.
It is about understanding the story the market is telling and using the right tools to read that story more effectively.