Most traders enter the markets with the wrong objective.
They spend months, sometimes years, searching for the perfect indicator. They download dozens of strategies, test hundreds of settings, and continuously jump from one system to another hoping to discover the secret that professional traders use. I know this because I was exactly the same when I started.
Like most beginners, I believed that profitability was hidden somewhere inside an indicator. Every time I lost money, I assumed I simply hadn’t found the right tool yet. One week I was trading moving averages, the next week I was testing RSI divergences, and shortly after that I was convinced that MACD was the answer. The result was always the same. Some winning trades, some losing trades, and absolutely no understanding of what the market was actually doing.
The turning point came when I stopped asking, “Which indicator should I use?” and started asking, “How does the market really work?”
That simple question changed everything.
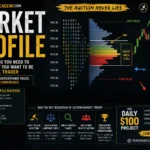
The reality is that markets are not random collections of candles moving up and down. Every tick that appears on your chart is the result of an ongoing auction between buyers and sellers. Every move higher represents an agreement that higher prices are acceptable. Every move lower represents a search for lower prices where business can be conducted. Once you begin looking at the market as an auction rather than a collection of indicators, your entire perspective changes.
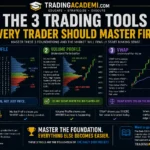
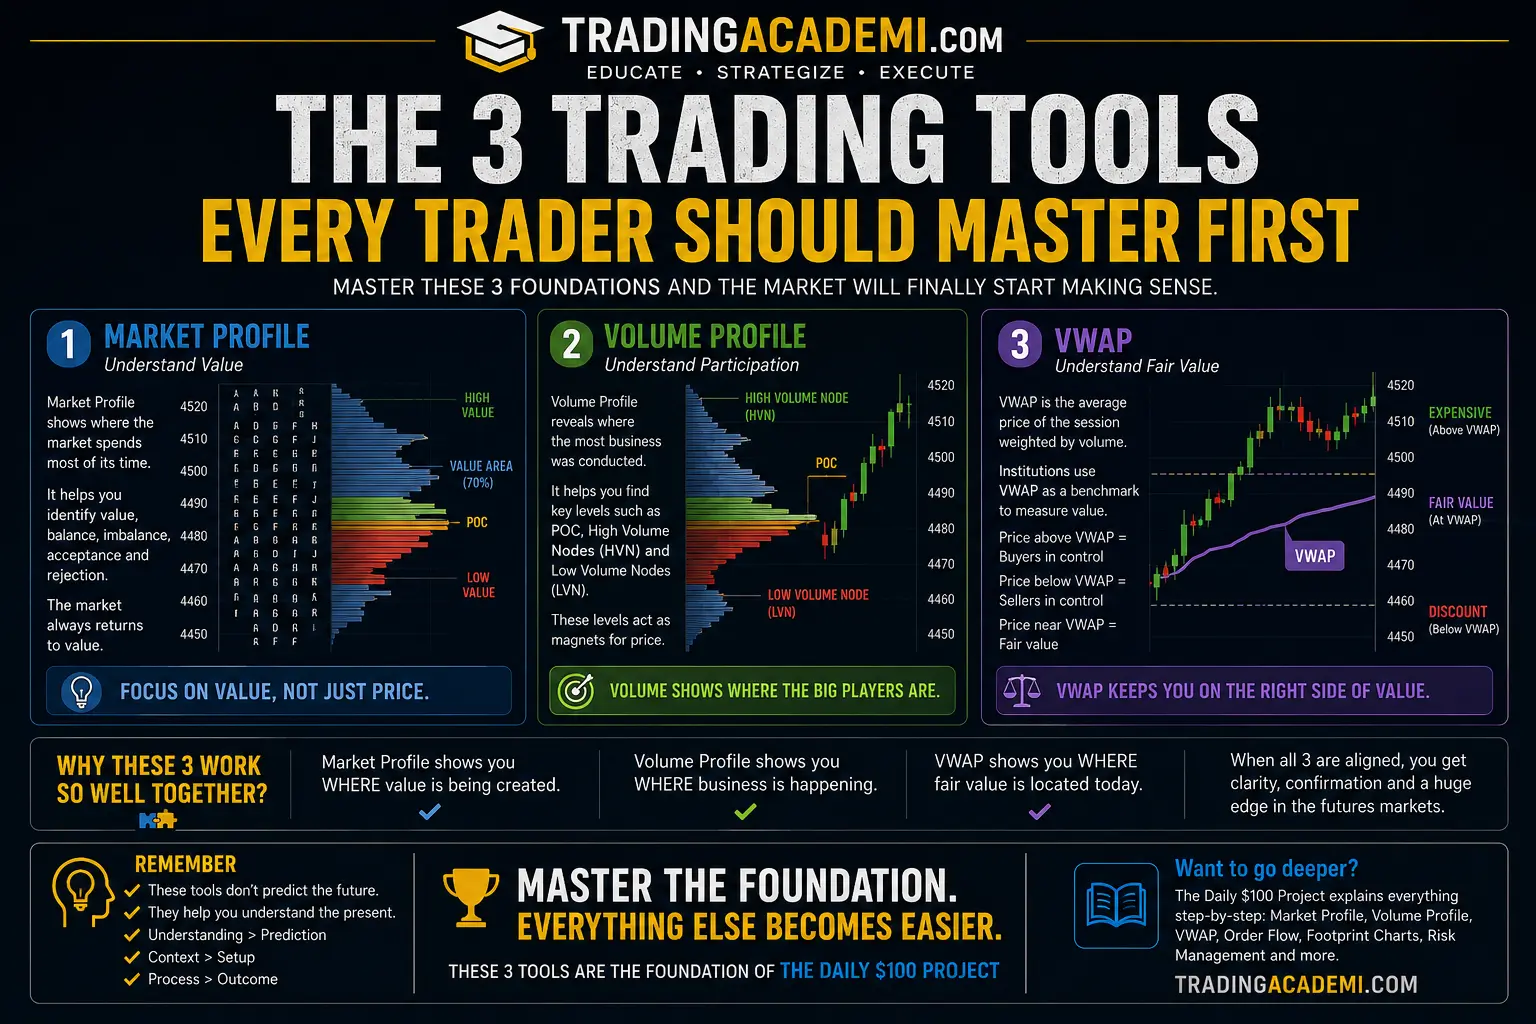
This is exactly why there are three tools that I believe every serious trader should learn before focusing on almost anything else: Market Profile, Volume Profile, and VWAP.
These are not indicators in the traditional sense. They do not attempt to predict the future. They do not promise magical buy signals or secret sell setups. Instead, they help traders understand what the market is doing, why it is doing it, and where the most important areas of interest are located.
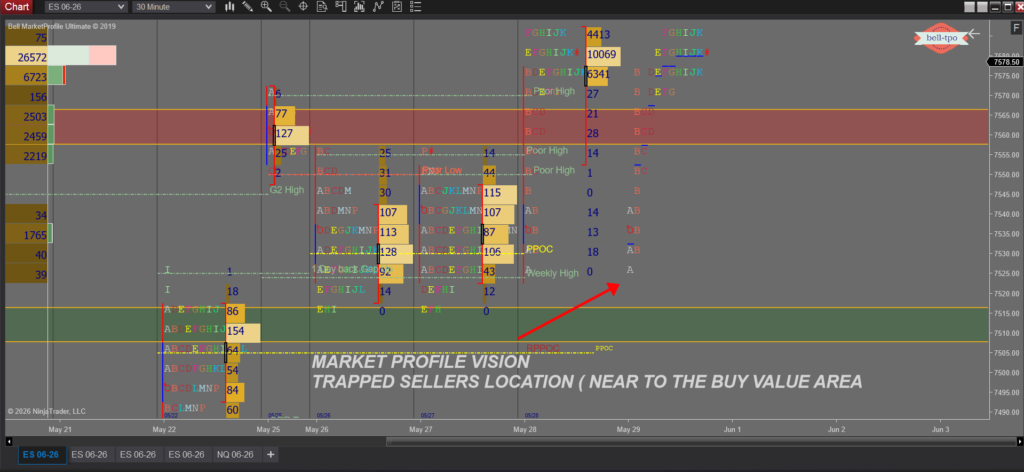
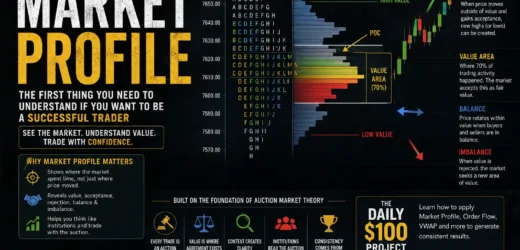
Market Profile was the first tool that completely changed the way I looked at charts. Before learning Market Profile, I saw support and resistance levels everywhere. Every swing high looked important. Every swing low seemed significant. The chart felt crowded with information but provided very little clarity. Market Profile introduced a completely different concept: value.
The market spends most of its time searching for value. Think about any marketplace in the world. Whether you’re buying a house, a car, or even groceries, there is always a price range where buyers and sellers agree that an item is fairly valued. Markets operate in exactly the same way. When buyers and sellers agree on price, the market becomes comfortable. It spends time there. It rotates there. It builds value there.
This is what Market Profile helps traders identify.
Instead of asking whether a candle is bullish or bearish, Market Profile asks a much more important question. Where is value being accepted? Understanding this concept alone can dramatically improve a trader’s ability to understand market structure.
One of the biggest mistakes new traders make is assuming that trends begin randomly. In reality, many trends begin because the market has rejected one area of value and started searching for another. Once you understand that process, trends stop looking random. They begin to look logical.
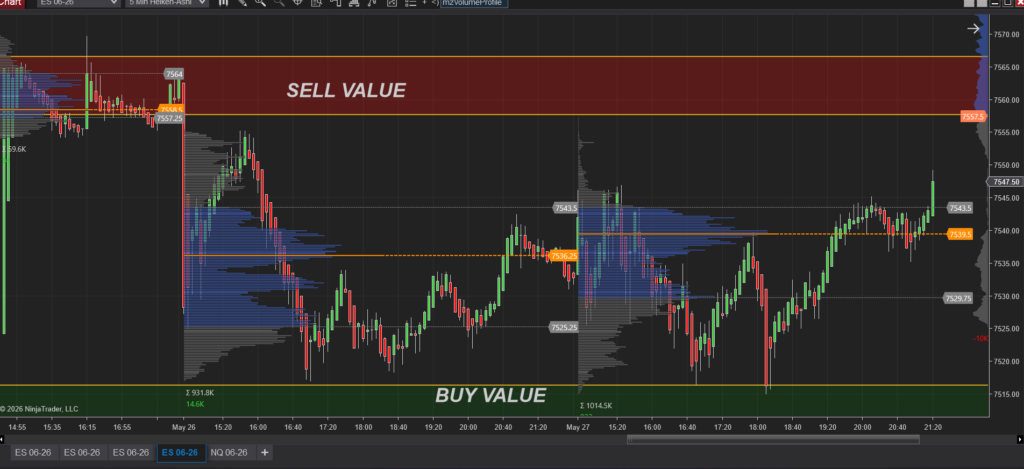
Volume Profile takes this understanding one step further.
If Market Profile shows where the market spent time, Volume Profile shows where the market conducted business. This distinction is extremely important because time and volume are not always the same thing.
Imagine two price levels. At the first level, the market spends an hour moving sideways with very little participation. At the second level, the market spends only ten minutes but exchanges a massive amount of contracts. Which level is more important?
Most traditional charting techniques cannot answer that question.
Volume Profile can.
By displaying the amount of volume traded at each price level, Volume Profile allows traders to see where institutions, funds, and large participants have been active. It reveals the areas where significant business has occurred. These areas often become important reference points in future trading sessions because markets have memory.
One concept that fascinated me when I first learned Volume Profile was the Point of Control, commonly known as the POC. The POC represents the price where the highest volume was traded during a session or within a selected profile. In simple terms, it is the price where buyers and sellers conducted the most business.
Professional traders pay very close attention to these levels because they often represent areas of fair value. Markets frequently revisit them, react around them, and use them as reference points for future decisions.
The more I studied Volume Profile, the more I realized that price alone tells only part of the story. Two charts can look almost identical, yet the volume distribution behind them can be completely different. One move may be supported by strong participation while another may be driven by weak activity. Understanding that difference can provide valuable context that traditional indicators simply cannot offer.
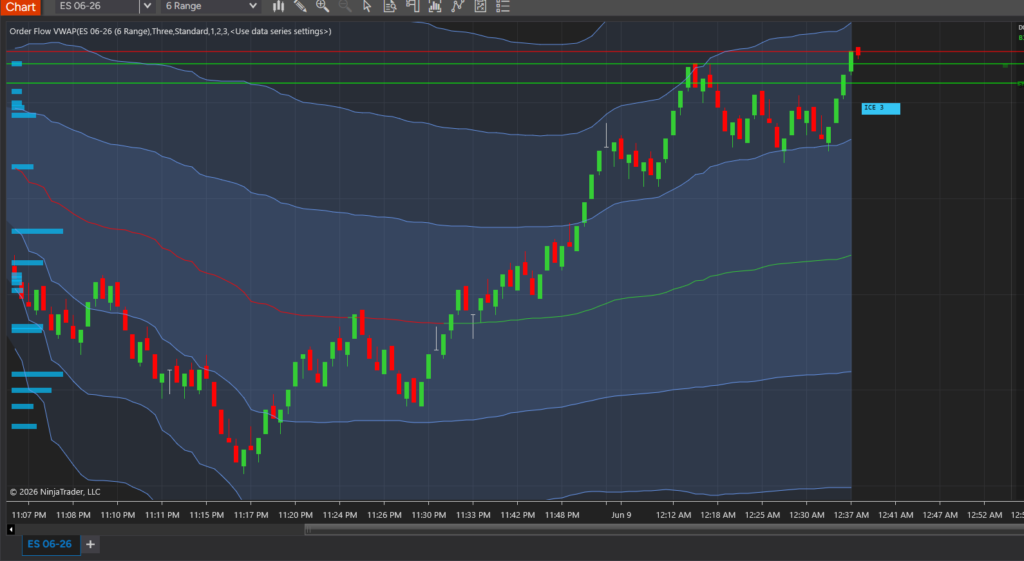
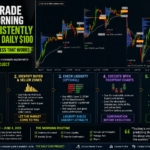
Then there is VWAP.
If Market Profile helps us understand value and Volume Profile helps us understand participation, VWAP helps us understand fairness.
VWAP stands for Volume Weighted Average Price. While the definition sounds technical, the concept is surprisingly simple. VWAP represents the average price traded during a session while taking volume into account.
Many institutional traders use VWAP as a benchmark. In fact, large funds often evaluate execution quality relative to VWAP. This alone should tell you how important it is.
One of the first things I look at during a trading session is where price is relative to VWAP. Is the market trading above it? Is it trading below it? Is it repeatedly returning to it?
These questions provide valuable information about who may currently be in control.
During strong bullish sessions, price often remains above VWAP for extended periods. During bearish sessions, the opposite tends to occur. During balanced sessions, price may rotate around VWAP for hours.
The beauty of VWAP is that it provides context without creating noise. It does not flood your chart with signals. It simply provides a reference point that helps you understand where value currently exists within the session.
What makes these three tools particularly powerful is how they complement each other.
Market Profile helps identify value.
Volume Profile helps identify participation.
VWAP helps identify fairness.
When all three are aligned, the market becomes significantly easier to understand.
Imagine a market trading above VWAP, holding above a major high-volume node identified by Volume Profile, while simultaneously building acceptance above a previous value area from Market Profile. Suddenly, the market is telling a very clear story. Buyers are accepting higher prices. Participation supports the move. Value is developing higher.
This does not guarantee a profitable trade.
Nothing in trading does.
But it dramatically improves the quality of information available to the trader.
Over the years, I have learned that successful trading has far less to do with prediction than most people believe. The best traders I know are not fortune tellers. They are observers. They spend their time understanding what the market is doing right now rather than trying to predict what it will do next week.
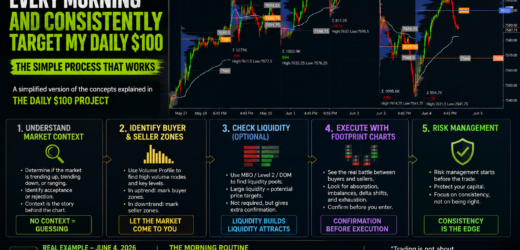
This is one of the core philosophies behind The Daily $100 Project.
Before discussing Footprint Charts, Delta, Imbalances, Absorption, Liquidity Traps, or advanced Order Flow concepts, traders must first understand the foundation upon which all of those concepts are built.
That foundation is Market Profile, Volume Profile, and VWAP.
Without understanding value, order flow becomes noise.
Without understanding participation, price becomes misleading.
Without understanding fairness, context becomes incomplete.
Every advanced concept in professional trading ultimately connects back to these principles.
That is why, if I had to start over from the beginning today, these would be the first three tools I would learn. Not because they are magical. Not because they guarantee profits. But because they teach traders how the market actually functions.
And once you understand how the auction works, everything else starts making sense.
The market stops looking random.
The candles stop looking chaotic.
The chart stops feeling overwhelming.
You begin to see structure, logic, and opportunity where most traders only see uncertainty.
And that is often the moment when a trader finally begins moving from guessing to understanding.