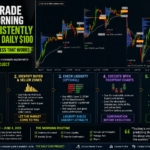

How I Trade Every Morning and Consistently Target My Daily $100
One of the most common questions I receive from traders is:
“How do you approach the market every morning, and how do you consistently find opportunities that can generate your daily trading goal?”
The reality is that there is no magic indicator, secret algorithm, or shortcut. What allows me to approach the market with confidence every day is having a structured process that I follow repeatedly.
This article is a simplified version of the concepts explained in much greater detail inside The Daily $100 Project. Some of the terminology may seem advanced at first, but don’t worry. I’ll keep things as simple as possible.
Let’s start with the foundation of everything.
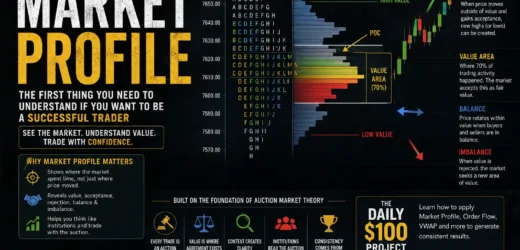
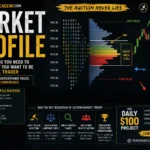
Step 1: Understanding Market Context
Before thinking about entering a trade, placing an order, or looking for a setup, the first thing I focus on every morning is the market context.
Most retail traders open their charts and immediately start searching for buy and sell signals. Professional traders do the opposite.
The first question should always be:
What is the market trying to do today?
Is the market trending higher?
Is it trending lower?
Is it balancing inside a range?
Is it accepting value or rejecting value?
These questions define the context.
Think of context as the story behind the chart. Every candle, every pullback, every breakout becomes easier to understand once you know the bigger picture.
For example, if the market is clearly in an uptrend, my primary objective is not to search for short positions. Instead, I want to identify areas where buyers may step back into the market.
Likewise, during a downtrend, my focus shifts toward finding areas where sellers are likely waiting.
Without context, every trade becomes a guess.
With context, every trade becomes a calculated decision.
This is one of the most important lessons taught throughout The Daily $100 Project because understanding context alone can dramatically improve your decision-making process.
Step 2: Identifying Buyer and Seller Zones
Once I have identified the market context, the next step is locating the areas where buyers or sellers are likely to participate.
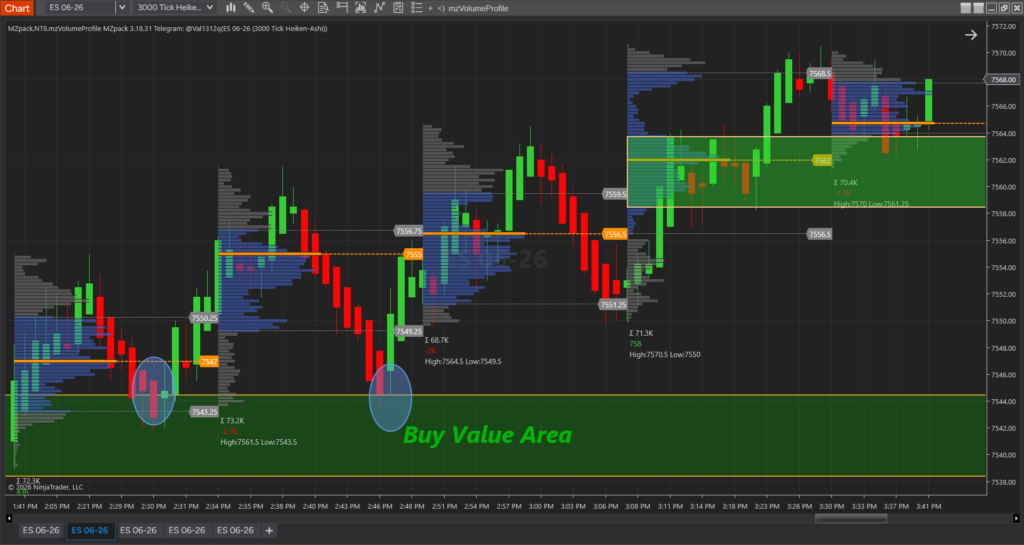
This is where Volume Profile becomes one of my favorite tools.
Volume Profile allows us to visualize where the market has conducted the most business. In simple terms, it helps us identify where large amounts of liquidity and transactions have taken place.
Markets are not random.
Large institutional participants leave footprints behind, and one of the easiest ways to identify those footprints is by studying volume distribution.
When I see an uptrend, I start marking areas where buyers previously showed strong interest.
When I see a downtrend, I begin marking areas where sellers aggressively controlled the auction.
These zones become my potential trading locations.
Rather than chasing price, I allow the market to come back to these predefined areas.
This approach immediately removes a huge amount of emotional trading because I already know where I am interested in doing business.
Inside The Daily $100 Project, we go much deeper into how Volume Profile works, how to identify high-volume nodes, low-volume nodes, acceptance areas, rejection areas, and how institutions often use these zones to accumulate or distribute positions.
Step 3: Using Market Depth and Liquidity (Optional)
If you have access to MBO data, Level 2 data, or Depth of Market information, you can take your analysis one step further.
The DOM allows traders to observe where large concentrations of liquidity are sitting in the order book.
Sometimes these liquidity pools become magnets for price.
The market often seeks areas where significant business can occur.
By studying liquidity concentrations, traders can gain additional insight into potential targets and reaction zones.
However, I want to make something very clear.
You do not need Level 2 data to become profitable.
Many traders become overwhelmed by advanced tools and believe they cannot succeed without them.
That is simply not true.
The majority of the concepts taught inside The Daily $100 Project can be applied using only price action, volume profile, and proper execution techniques.
Level 2 data is a bonus, not a requirement.
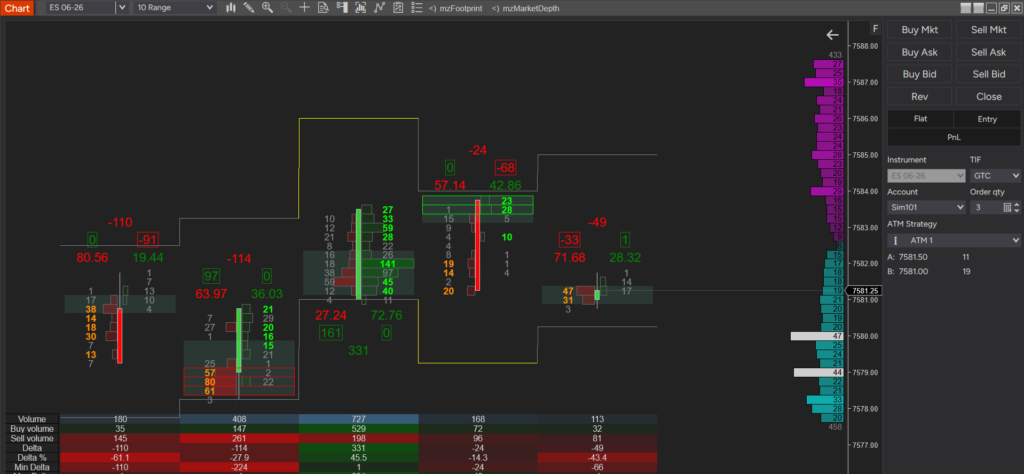
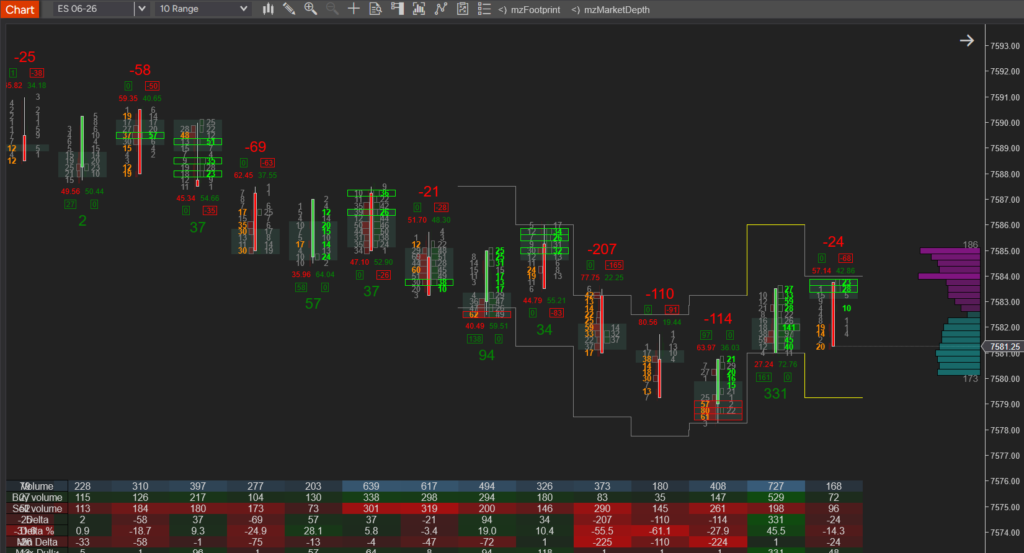
Step 4: Executing the Trade Using Footprint Charts
Once price reaches one of my predefined zones, I begin looking for confirmation.
This is where the Footprint Chart becomes incredibly powerful.
The Footprint Chart allows us to see what is actually happening inside each candle.
Instead of only looking at the final result of a candle, we can analyze the battle between buyers and sellers that created it.
We can observe:
- Aggressive buying
- Aggressive selling
- Delta shifts
- Absorption
- Exhaustion
- Imbalances
- Trapped traders
This information provides a level of transparency that traditional candlestick charts simply cannot offer.
For example, imagine price reaches a buyer zone during an uptrend.
At that location, I might observe aggressive selling entering the market, but price refuses to move lower.
This often indicates absorption.
In other words, sellers are trying to push the market down, but larger buyers are absorbing that pressure.
That information can become a valuable confirmation signal.
Likewise, during a downtrend, I may observe aggressive buying entering the market while price struggles to move higher.
This could indicate that sellers remain in control.
The Footprint Chart is not used to predict the future.
It is used to confirm what is happening right now.
This distinction is extremely important.
Inside The Daily $100 Project, we spend significant time studying footprint concepts, execution techniques, absorption, delta behavior, and professional trade confirmation methods.
Step 5: Risk Management
Now we arrive at the most important part.
Risk management.
Most traders think risk management is simply setting a stop loss.
In reality, risk management starts long before the trade is entered.
If you follow a structured process:
- Understand context
- Identify quality zones
- Wait for confirmation
- Execute only when conditions align
You are already practicing risk management.
Risk management is not about avoiding losses.
Losses are part of trading.
Risk management is about ensuring that no single trade can significantly damage your account.
The goal is consistency.
Many traders focus on making $1,000 in a day.
I focus on repeating a process.
When the process is repeated correctly, the profits become a byproduct.
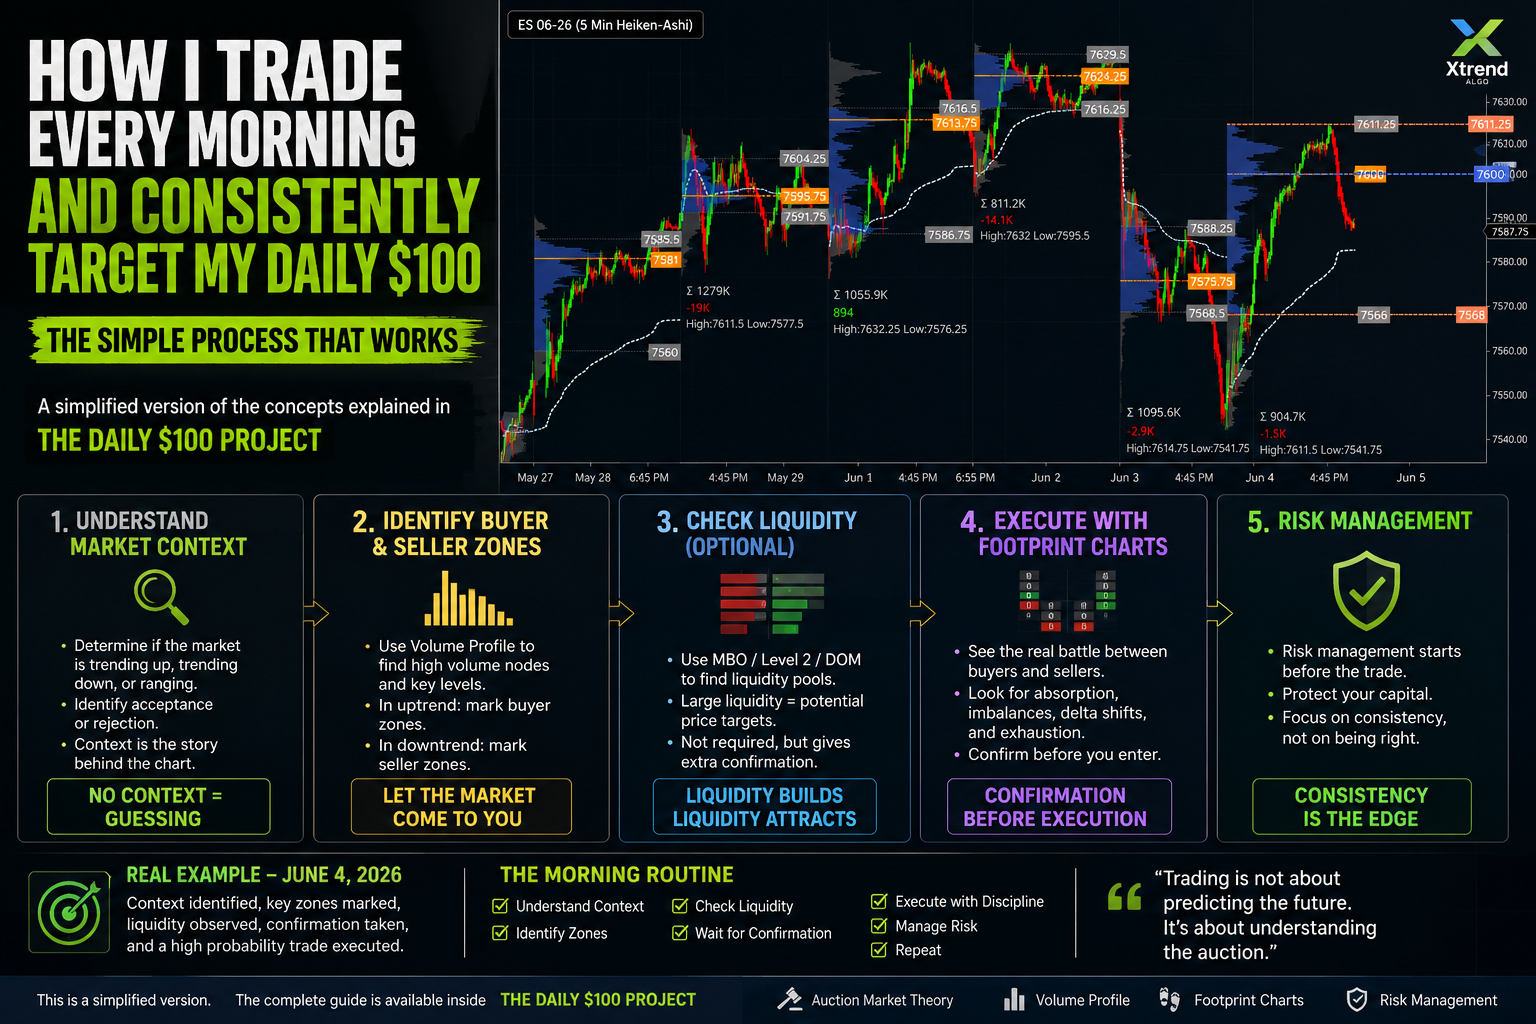
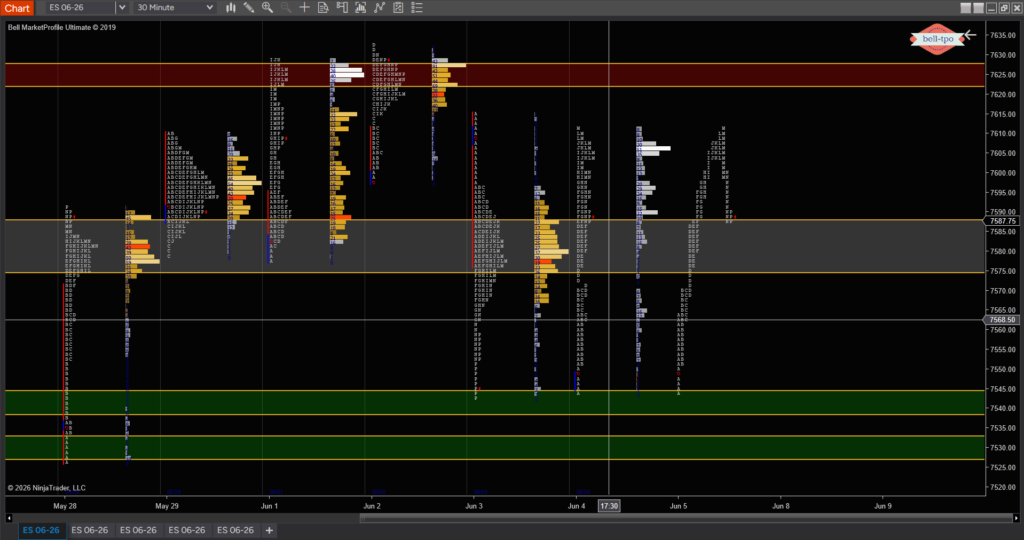
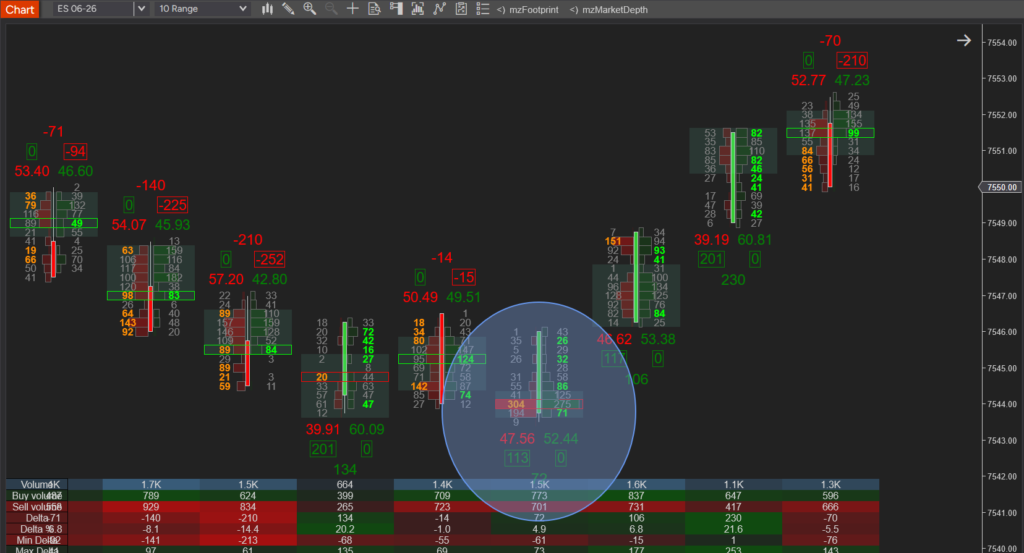
Real Example – June 4, 2026
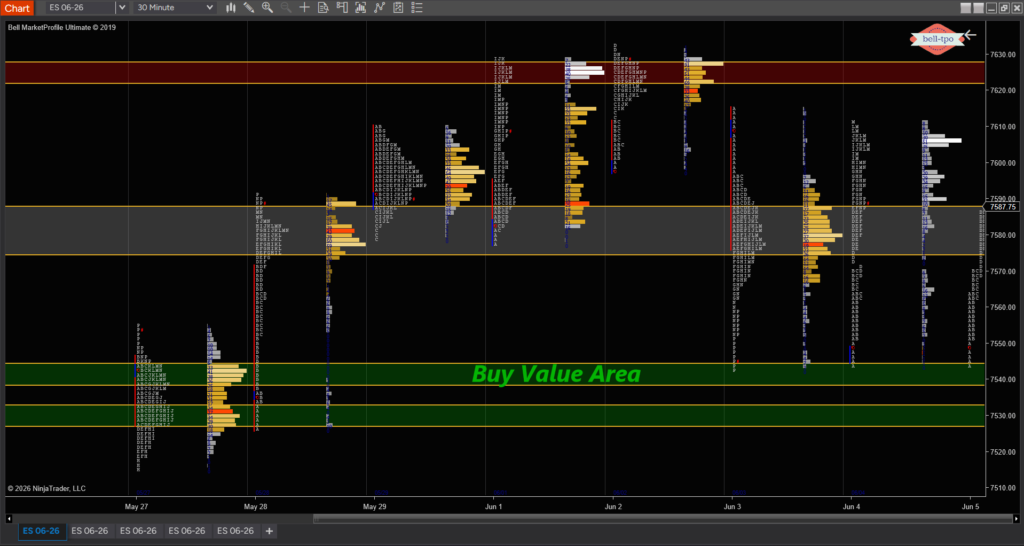
The chart shown above is a perfect example of how this process works.
The first step was identifying the overall market context.
Next, key volume profile levels were marked where significant business had previously taken place.
As price approached those areas, I monitored the market for reactions and execution opportunities.
Using the combination of context, volume profile, and footprint confirmation, the market provided a structured opportunity without the need to guess where price would go next.
This is the exact type of workflow that I follow every morning.
Some days the market provides multiple opportunities.
Some days it provides none.
The objective is not to force trades.
The objective is to wait for the market to come to you.
Many traders search for the perfect indicator. And others spend years looking for a secret strategy. What I eventually discovered is that consistency comes from understanding how markets actually work. Every morning I follow the same process:
Understand the context.
Identify buyer and seller zones.
Monitor liquidity.
Wait for confirmation.
Execute with discipline.
Manage risk.
Repeat.
This article only scratches the surface of what is covered inside The Daily $100 Project.
The complete guide explains every concept step-by-step, including Market Profile, Auction Market Theory, Volume Profile, Footprint Charts, Execution Techniques, Risk Management, and the exact framework I use when approaching the futures markets every day.
Because trading is not about predicting the future.
It’s about understanding the auction.